Investigations of hyperspectral drill core data from the Paris silver deposit, South Australia
Georgina Gordon1 and Ben Nicolson2
1 Geological Survey of South Australia, Department for Energy and Mining
2 Archi Indonesia
Georgina.Gordon@sa.gov.au
Download this article as a PDF (10.9 MB); cite as MESA Journal 97, pages 21–33
Published December 2022
Introduction
Across the Gawler Craton, hydrothermal alteration associated with Hiltaba Suite granite intrusions has caused widespread changes to the mineralogy of host lithologies. Where the Hiltaba Suite intrusion has resulted in mineralisation, mineralogical changes provide insight into hydrothermal processes and can be used as an aid in exploration. These changes, particularly to fine-grained clay mineralogy, are difficult to distinguish visually, and yet easily detected by non-destructive hyperspectral scanners, such as the HyLogger™ 3.
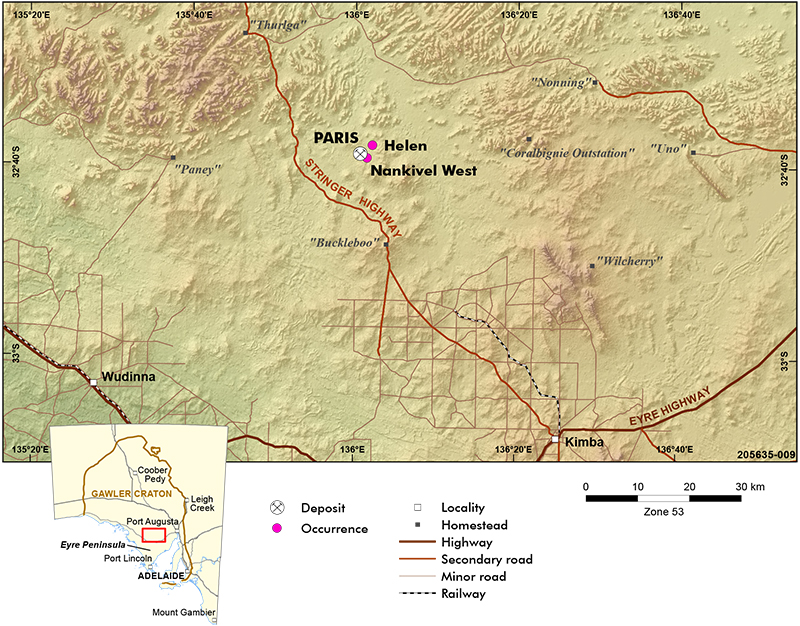
A memorandum of understanding was executed in January 2015 between Investigator Resources Limited and the Geological Survey of South Australia to undertake hyperspectral scanning and analysis of drill samples from the Paris deposit, located near the southern margin of the Gawler Ranges, 66 km northwest of Kimba, in South Australia (Fig. 1). The intent was to share resources that might assist with geological logging and interpretation of drill core and drill chips. The focus was on the mineral assemblage associated with the hydrothermal alteration within the deposit that could then be applied across the region using hyperspectral imagery. The outputs also have a wider implication for the rapid characterisation of minerals in close proximity to epithermal-style precious metal deposits, and the role for spectral methods in exploration for similar hydrothermal alteration and mineralisation throughout the district (Caruso et al. 2021).
Figure 1 Location of the Paris silver deposit along the southern margin of the Gawler Ranges, South Australia.
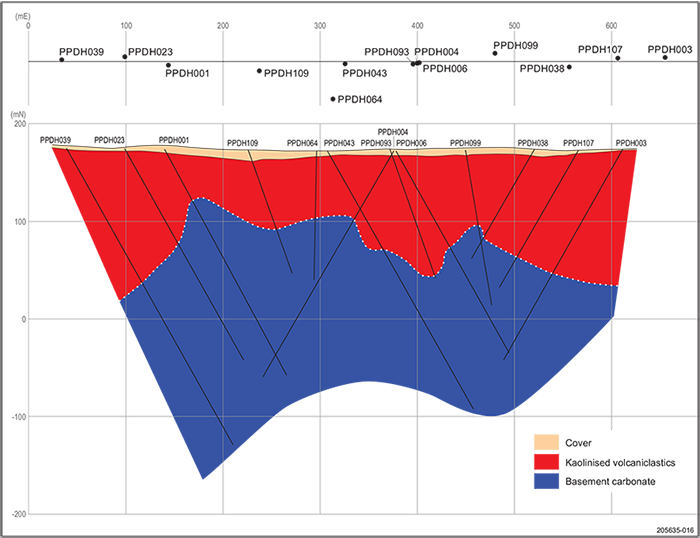
Drill core samples were selected by Investigator Resources from section line 7 (Fig. 2) through the central portion of the Paris deposit and submitted for hyperspectral scanning and analysis at the South Australia Drill Core Reference Library. Cores from 15 drillholes (average length 190 m) were scanned totalling 2,603.3 m.
The objectives were to:
- Aid geological logging of drill cores located along line 7 of the Paris deposit.
- Determine the spectral characteristics of hydrothermal alteration across the deposit.
- Examine the spatial relationship between alteration mineralogy and mineralised zones.
Figure 2 Cross-section of the Paris deposit along line 7.
This paper presents the results of hyperspectral mineral domaining, interpretation of spectral parameters for white micas, kaolinite and carbonate, and a comparison of felsic and mafic components using spectral scalars.
Hyperspectral data collected during this study is publicly available via the South Australian Resources Information Gateway (SARIG) and AuScope’s National Virtual Core Library Discovery Portal.
Geological setting and mineralisation
The majority of silver and base metal mineralisation on the northern Eyre Peninsula is hosted by Paleoproterozoic Hutchison Supergroup metasediments, often in association with serpentine marble or calc-silicate lithologies (Blissett et al. 1993), making these metamorphic rocks an important target for mineral exploration in this region.
The Paris silver mineralisation is distributed across the unconformable contact of Paleoproterozoic Hutchison Supergroup metasedimentary rocks with overlying Mesoproterozoic volcanics of the lower Gawler Range Volcanics. The Hutchison Supergroup metasediments were infolded with underlying Neoarchean to Paleoproterozoic granitic and gneissic basement rocks of the Sleaford Complex during the Kimban Orogeny (c. 1730–1690 Ma). Emplacement of felsic intrusives during the Kimban Orogeny led to the deformation and metamorphism of the Peter Pan Supersuite (Werner et al. 2017). After the Kimban Orogeny, a widespread magmatic event across the Gawler Craton, described as the c. 1595–1575 Ma Gawler Range Volcanics – Hiltaba Suite event, resulted in widespread emplacement of A- to I-type granites and extensive outpouring of volcanic rocks (Jagodzinski et al. 2012). ‘Lower’ units consist of dacitic to rhyolitic pyroclastic deposits, including ignimbrites and tuffs, of Waganny Dacite and Bittali Rhyolite (McAvaney and Wade 2015) and ‘upper units’ of thick dacite and rhyolite lava flows that create the characteristic landforms of the Gawler Ranges.
In the region of the Paris deposit, fold axes in Hutchison Supergroup metasedimentary rocks are trending NW–SE and are crosscut by fractures trending NE–SW and NNE–SSW (Anderson 1991). Fold limbs are mostly steeply dipping with fold axes inclined to the northeast. The sequence of metasedimentary rocks begins as a muscovitic quartzite, equated with the Warrow Quartzite, showing well-developed schistosity and containing minor biotite, graphite, sillimanite and pyrite. It is overlain by amphibolite composed of hornblende, feldspar, quartz and almandine garnet, interlayered with muscovite schist and marble grading into graphitic schist. This is in turn overlain by biotite schist consisting of quartz, feldspar, biotite and muscovite with minor tourmaline (Coutts et al. 1992). Regional metamorphic grade is estimated at upper amphibolite facies, based on the presence of sillimanite, amphibole and almandine garnet. Regional Kimban metamorphism is modified locally by subsequent effects of intrusion-related contact metamorphism and structurally controlled hydrothermal alteration. The metasedimentary package is similar to that described for the Hutchison Supergroup elsewhere on Eyre Peninsula (e.g. Parker 1993; Vassallo and Wilson 2001; Szpunar et al. 2011) but assignment of stratigraphy, with the exception of the basal Warrow Quartzite, is tenuous given the generally poor continuity of outcrop and complex infolding with crystalline rocks of the underlying Sleaford Complex.
The more prominent hills to the north of Paris are composed of relatively fresh Gawler Range Volcanics. In contrast, the rocks at Paris are variably weathered, typically to depths of 40–60 m, with the weathering profile consisting of a thin ferruginous and silicified capping over mottled iron-rich clays and a thick highly leached saprolite zone which grades downward into saprock and fresh bedrock (Brown et al. 1992).
Evidence for hydrothermal alteration along the southern margin of the Gawler Ranges is associated with numerous small gold, silver and base metal prospects, including Menninnie Dam (Pb–Zn–Ag) and Parkinson Dam (Ag–Pb–Zn–Au) (Wade et al. 2014). The Paris deposit is situated to the south of the Uno Fault that separates outcrops of younger lavas of the Gawler Range Volcanics, to the north, from occurrences of older volcanics and volcaniclastics of the lower Gawler Range Volcanics to the south. South of the Uno Fault, basement outcrops form less than 20% of a landscape dominated by thin Cenozoic sedimentary cover of predominantly aeolian, colluvial and fluvial sediments (Werner et al. 2017). Patchy outcrop and subcrop of variably weathered Archean and Paleoproterozoic metamorphosed basement occur in erosional windows within the overlying thin residual cover of flat-lying ignimbritic Bittali Rhyolite and are intruded by Hiltaba Suite granite and Gawler Range Volcanics dykes.
The Paris deposit occurs on the unconformity between Paleoproterozoic Hutchison Supergroup carbonate metasediments and the overlying volcaniclastics of the Bittali Rhyolite. The silver deposit is situated adjacent to the interpreted northeastern margin of the Buckleboo Granite (Hiltaba Suite) and several dyke sets and a small granodiorite stock that is exposed near Nankivel Hill. The pattern of mineralisation and related igneous intrusions show an association with northeast-trending structures that sinistrally offset the Uno Fault.
The majority of the mineralisation at Paris is hosted by a flat-lying body of polymict breccia that extends over 1.5 km and is up to 400 m wide and ~70 m in thickness. The host breccia interfingers with an unmineralised ignimbrite (Fig. 2). Wallrock of graphitic metasediment mostly corresponds with the limits on the extent of mineralisation. The mineralisation is primarily hosted in overlying volcanic breccia sitting directly on metamorphosed dolomitic basement (Paul et al. 2015), and variably mineralised to ~20 m below the unconformity. At depth, the largely unaltered marble is partly fractured and contains minor mineralisation. The polymict breccia includes various volcanic, granitic, dolomitic, graphitic and sulfidic clasts. Extremely silver-rich carbonate-sulfide intersections encountered in drillholes may represent remnant megaclasts. Fluorite-bearing rhyolite dykes show peperitic textures where these merge with the polymict breccia. The bulk of the silver mineralisation is associated with fine-grained disseminated pyrite and consists of acanthite (Ag2S), native silver inclusions in pyrite, silver-bearing galena (producing lead grades of about 0.6%), and less commonly with sphalerite and arsenopyrite. The gangue minerals are predominantly kaolin and manganese carbonate. The total silver resource at the Paris deposit is estimated at 18.8 Mt at 88 g/t Ag and 0.52% Pb, giving 53.1 Moz of contained silver and 97.6 kt of lead at cutoff grade 30 g/t Ag (Investigator Resources 2021).
Spectral analyses – methods
The HyLogger spectral scanning instrumentation was developed by CSIRO to rapidly and objectively log drill core using reflectance spectroscopy of infrared wavelengths to map changes in mineralogy. HyLogger 3-3 incorporates 3 spectrometers: visible and short-wave infrared (380–2,500 nm), and thermal infrared (6,000–14,500 nm). Spectra from the surface of the core, averaged over 8 mm intervals, were recorded continuously along the centreline of the core, producing about 125 spectra per metre of geological material. HyLogger also has a high resolution linescan digital camera capturing an image at every one millimetre to produce a continuous image of the core that can be used for visual confirmation of drill core features related to spectral data. The instrumentation includes a simple laser profilometer to measure the height of the sample and also to record cracks in the core and tray ends, which are used as part of the quality control in data processing and are removed from the dataset during processing. All cores were prepared for scanning by presenting the cut surface and vacuuming to remove contamination from the surface formed during the core cutting process.
The spectral data was processed and interpreted using specialist software – The Spectral Geologist 8™ (TSG) Hot Core. Each spectrum was automatically deconvolved and the relative proportions of minerals derived using inbuilt processing software, The Spectral Assistant™. Mineral matches are made using algorithms that compare deconvolved spectral components to a library of reference spectra of pure mineral specimens that comprise a representative set of the most common rock-forming minerals (Wells et al. 2016). TSG software was also used to view and plot spectral data, with reference to the co-registered sample imagery.
After preliminary assessment of the automated Spectral Assistant results, intervention to restrict the suite of possible mineral matches (restricted mineral set) was applied to remove spurious results and to refine the spectral matching. This restricted mineral set was informed by the petrology provided by Investigator Resources, spectral mineral matching methods, and the mineral assemblages associated with epithermal-style alteration described in Corbet and Leach (1998). This approach was applied to all drill core and drill chip samples in this investigation, and in this case a specific mineral set was applied to each identified mineralogical ‘spectral domain’. Results of mineral analyses were later downsampled to 1 m intervals and various standard mineral spectral parameters, or scalars, were derived using the Spectral Geologist software to improve the identification of specific minerals. The semi-quantitative mineral proportions and the various scalars for the downsampled (1 m resolution) spectral data were exported as text files suitable for importing and visualisation in the GOCAD 3D modelling environment.
Results of spectral scanning
Scanned drill core results can be viewed in SARIG by searching the drillhole numbers listed in Table 1.
In this paper the results of scanning are presented as a comparison between the lithological descriptions, the geological logs provided by Investigator Resources and the hyperspectral mineral interpretation of the data.
Broadly speaking the deposit can be characterised into 2 dominant spectral mineral domains:
- Upper domain. Dominated by kaolinite, white micas, quartz and feldspars corresponding to relatively flat-lying volcanic breccias – similar to, if not, the Bittali Rhyolite (altered).
- Lower domain. Dolomite-rich, steeply dipping, variably calc-silicate altered (skarn style) carbonate (previously correlated with the Katunga Dolomite) that is intruded by small granitic dykes.
Table 1 Selection of drill core and drill chip material submitted for hyperspectral scanning and analysis from the Paris deposit, line 7
| Drillhole name | SA Geodata drillhole number | Depth interval (m) | Metres scanned | Trays scanned | |
| From | To | ||||
| PPDH001 | 339097 | 20.40 | 260.70 | 240.30 | 52 |
| PPDH003 | 339099 | 71.90 | 249.30 | 177.40 | 35 |
| PPDH004 | 339100 | 80.70 | 266.89 | 186.19 | 37 |
| PPDH006 | 339102 | 110.70 | 237.40 | 126.71 | 28 |
| PPDH023 | 339181 | 42.40 | 249.70 | 207.30 | 60 |
| PPDH038 | 339196 | 0 | 129.50 | 129.50 | 38 |
| PPDH039 | 339197 | 0 | 350.80 | 350.80 | 107 |
| PPDH043 | 339201 | 0 | 303.99 | 303.99 | 81 |
| PPDH064 | 341313 | 0 | 187.66 | 187.66 | 53 |
| PPDH093 | 341342 | 0 | 139.00 | 139.00 | 51 |
| PPDH097 | 341346 | 0 | 110.80 | 110.80 | 43 |
| PPDH099 | 341348 | 0 | 161.00 | 161.00 | 58 |
| PPDH107 | 341356 | 0 | 163.70 | 163.70 | 64 |
| PPDH109 | 341358 | 0 | 133.95 | 133.95 | 50 |
| Total | – | – | – | 3,250.10 | 835 |
Cover units
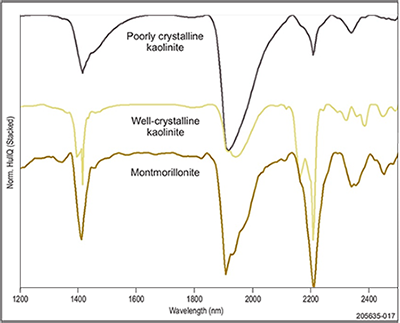
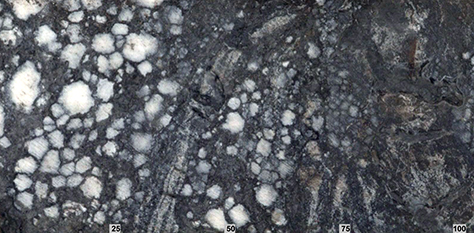
The cover sequence across the deposit varies in thickness, with an average breadth between 40–60 m. The cover unit is described as a friable red, ferruginous soil (spectral domain 9; Table 2; Appendix). Spectrally, this domain is dominated by poorly crystalline kaolinite which indicates the transported nature of the cover units (Pontual et al. 1997). This domain also contains competent saprolite dominated by montmorillonite (smectite), well-crystalline kaolinite and quartz (Fig. 3). In this setting these minerals are associated with the weathering or alteration of felsic rocks. The texture of this cover sequence varies from friable transported material to competent in situ weathering of the host lithology (Fig. 4).
Table 2 Spectral mineral domains identified in drillholes, Paris silver deposit, line 7
Table 2 photo numbers. Domain 1 (Photo 418726), Domain 2 (Photo 418722), Domain 3 (Photo 418723), Domain 4 (Photo 418724), Domain 5 (Photo 418725), Domain 6 (Photo 418736), Domain 7 (Photo 418729), Domain 8 (Photo 418730), Domain 9 (Photo 418735), Domain 10 (Photo 418737), Domain 11 (Photo 418738), Domain 12 (Photo 418734)
Figure 3 Spectral response for poorly crystalline kaolinite, well-crystalline kaolinite and montmorillonite from drill core PPDH038 cover sequences.
Figure 4 Ferruginous soil from PPDH038, tray 1, 0–3.1 m. Row 1, friable transported material. Rows 2–3, competent and weathered in situ saprolite dominated by smectite (montmorillonite) and well-crystalline kaolinite.
Volcaniclastic succession – Bittali Rhyolite
The Bittali Rhyolite is regionally described as ~200 m thick assemblage of welded ash flows and lavas (yellow-brown when weathered), and grey, green-brown, red-brown and cream coloured rhyolite grading to rhyodacite (Blissett et al. 1993). Textures vary from very fine grained and banded with devitrified pumice streaks and deformed glass shards, to porphyritic with phenocrysts of potassic feldspar, rounded quartz and some plagioclase (Blissett et al. 1993).
Along line 7 in the Paris deposit, the upper volcaniclastic has similar mineral compositions; however, there is enough mineralogical variation to differentiate 4 spectral mineral domains. The domains were created to give an overview of the main minerals used to differentiate units in the deposit. Each spectral domain may encompass several of the lithologies logged by Investigator Resources.
- Domain 2. Cream-coloured, fine-grained rhyolite dominated by well-crystalline kaolinite and quartz with phengitic white mica, minor carbonates and minor iron oxides (Table 2; Fig. 5a).
- Domain 3. Yellow-brown (iron oxide staining), fine-grained, welded ash flow tuff comprised of well-crystalline chlorite, smectite, talc, dark micas, quartz and iron oxides (Fig. 5b). This unit occurs predominantly in drill core PPDH001 at the contact with domain 5. The original logging by Investigator Resources included fractured dolomite, but no carbonates were detected in this domain.
- Domain 4. Variably coloured pale brown to cream or pale grey, fine-grained rhyodacite made up of quartz, potassic feldspar and phengitic white micas (Fig. 5c).
- Domain 5. Pale brown and black unit composed of quartz, plagioclase and white mica (phengite and muscovite). This domain is associated with Investigator Resources logged massive sulfides and rhyolite in which the intruding rhyolite mixes with the polymict volcanic breccia (Fig. 5d) and can be traced using spectral mineralogy and geochemistry (hafnium and zirconium) along the line.
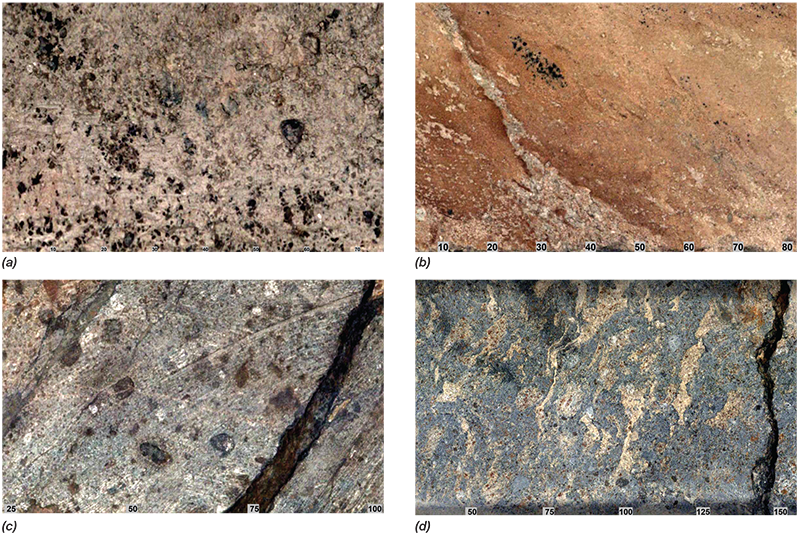
Figure 5 Spectral mineral domains associated with the lower Gawler Range Volcanics from line 7 (scale mm). (a) Domain 2, cream-coloured, kaolinised rhyolite, PPDH038, 39.96 m. (Photo 418722) (b) Domain 3, iron-stained, weathered welded ash flow, PPDH003, 150.73 m. (Photo 418723) (c) Domain 4, altered rhyolite–rhyodacite, PPDH001, 84.85 m. (Photo 418724) (d) Domain 5, peperitic texture, PPDH107, 125.15 m. (Photo 418725)
Dolomitic carbonate and calc-silicate assemblage
The dolomitic marble forming the lower portion at the Paris deposit is as a massive to poorly layered, white to pale grey, medium-grained rock. Layers within the lower carbonate include calc-silicate assemblages with layers of calcite, diopside, tremolite and serpentine containing relics of forsterite (Parker 1993). High-grade metamorphic zones are characterised by yellow-green serpentine nodules and diopside, whereas tremolite, actinolite and talc are found in lower grade areas (Parker 1993).
The carbonate–calc-silicate stratigraphic unit/package with felsic intrusives has also been subdivided into several spectral mineral domains:
- Domain 1. White, coarse-grained magnesite nodules suspended in a dark grey, fine-grained graphitic matrix. This unit is only present along line 7 in drillhole PPDH001 on the western end of the deposit (Fig. 6). The graphite and magnesite in this area corresponds to the metasediments of the basement (Paul et al. 2015). A spectral carbonate scalar developed by Green and Schodlok (2016) was also used to distinguish the carbonates across the basement marble using spectral features from the thermal infrared at 1,1000 and 13,900 nm. This worked very well in PPDH001 where magnesite occurs in the younger sequences in conjunction with graphite and could be used to rapidly log this marker horizon throughout the deposit.
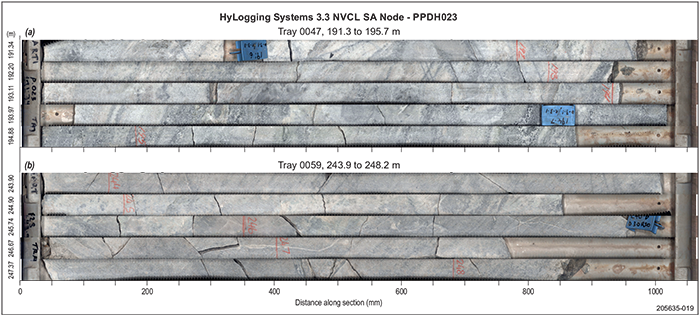
- Domain 6. Cream to grey coloured, medium- to coarse-grained altered dolomite- and calcite- rich carbonate. Visually these layers are difficult to recognise; however, using spectral methods, layers can be quickly logged by plotting a change from dolomite (magnesium) rich (Fig. 7a) to calcite (calcium) rich carbonates (Fig. 7b).
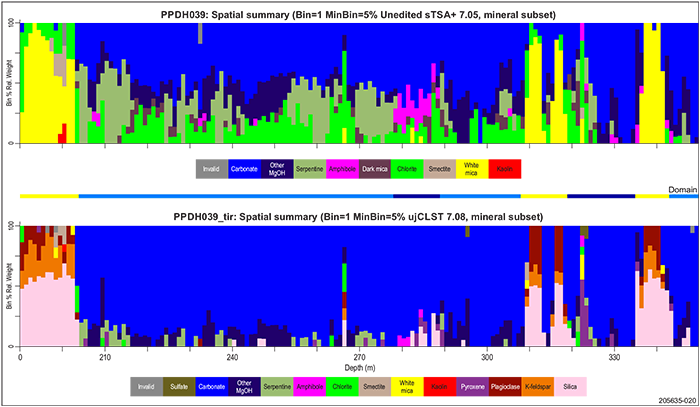
- Domain 10. Pale cream to pale grey talc-rich, skarn-like calc-silicate alteration assemblage, possibly a product of contact metamorphism around felsic intrusives (Fig. 8). The mineralogy is dominated by talc, quartz and orthoclase with minor sulfate and carbonate (e.g. PPDH003).
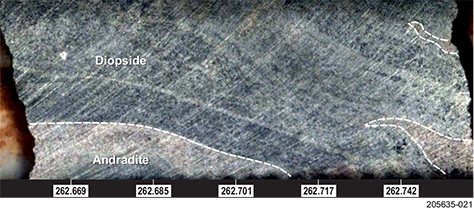
- Domain 11. Cream-coloured, fine- to medium-grained, low-grade calc-silicate alteration mineral assemblage dominated by magnesium-rich chlorite, carbonate, plagioclase and quartz with minor dark micas, tremolite, actinolite and talc. This mineral assemblage is significant in PPDH039 (Fig. 8), and where andradite has been identified in proximity to the felsic intrusives (Fig. 9).
- Domain 12. Dark coloured calc-silicate skarn alteration minerals similar to spectral domain 11. However, this narrow domain can be found in direct contact with felsic intrusions (especially the pegmatite at 285.7 m in PPDH043) and can be separated into low-grade alteration composed of serpentine, talc and calcite (Fig. 10a), and high-grade alteration (Fig. 10b) characterised by yellow-green serpentine nodules and diopside.
Figure 6 Domain 1, white magnesite nodules suspended in fine-grained graphitic matrix, PPHD001, 22.81 m (scale mm). (Photo 418726)
Figure 7 Visual differences in the Katunga Dolomite, PPDH023. (a) Dolomite (magnesium) rich layers, tray 47. (b) Calcite (calcium) rich layers, tray 59.
Figure 8 Spectral mineral summary for PPDH039, where low-grade calc-silicate alteration is dominated by talc and serpentine throughout the lower carbonate. Higher grade, skarn-style alteration occurs with the felsic intrusives, domain 7.
Figure 9 Pink andradite layers with dark pyroxene (diopside) alteration from PPDH043, 262.7 m (scale mm). (Photo 418734)
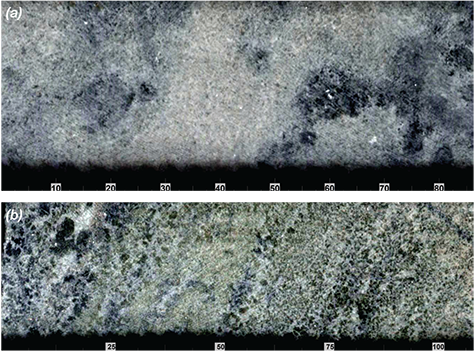
Figure 10 Calc-silicate alteration associated with felsic intrusives in the basement carbonate (scal e mm). (a) Low-grade calc-silicate alteration primarily composed of serpentine and talc with calcite, PPDH039, 280.64 m (scale mm). (Photo 418727) (b) High-grade calc silicate alteration composed of yellow-green serpentine nodules with diopside, PPDH023, 208.78 m. (Photo 418728)
Felsic intrusions
Several narrow felsic intrusives (granite to granodiorite) were logged by Investigator Resources in the underlying carbonate-rich basement rocks in association with northeast-trending structures along the southern edge of the Uno Fault. These intrusives have been classed into 2 spectral mineral domains:
- Domain 7. Cream to pale brown, fine- to medium-grained granitic intrusive composed of quartz, plagioclase, potassic feldspar, smectite and muscovitic white mica (Fig. 11a). Further spectral subdivision into granitic and granodioritic varieties (as logged by Investigator Resources) can be distinguished as plagioclase becomes more prominent in the granodiorite dykes common in drill cores towards the eastern end of line 7.
- Domain 8. Cream to pale brown, coarse-grained granite composed of quartz and plagioclase with paragonitic white mica and muscovite (Fig. 11b).
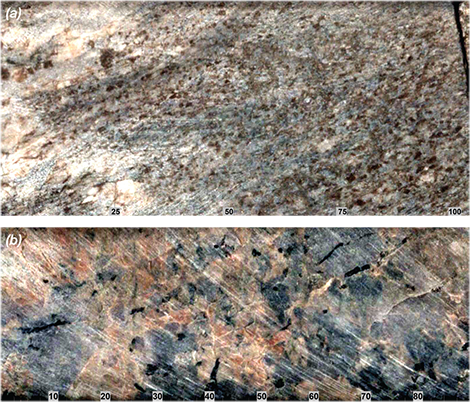
Figure 11 (a) Domain 7, fine-grained granitoid dominated by quartz and potassic feldspar from PPDH001, image from 249.61 m (scale mm). (Photo 418729) (b) Domain 8, coarse-grained granite composed of quartz, plagioclase and paragonitic white mica, PPDH043, image from 283.45 m (scale mm). (Photo 418730)
Discussion
Spectral mineralogy has been used across line 7 of the Paris deposit as a non-destructive, analytical method to distinguish mineral assemblages. The aim of the project was to use non-destructive hyperspectral scanning methods to assist the geological logging of key units in this complex environment. Visual logging by Investigator Resources produced over 30 different lithological distinctions, many with similar mineral compositions. Spectral scanning enabled the subdivision of the complex lithological associations in the Paris deposit, each characterised by a specific mineral assemblage. The mineralogical characteristics for 12 distinctive spectral domains captured across the line are described above. Several spectral features of those classifications are discussed below.
White micas, potassic feldspar and the felsic–mafic index
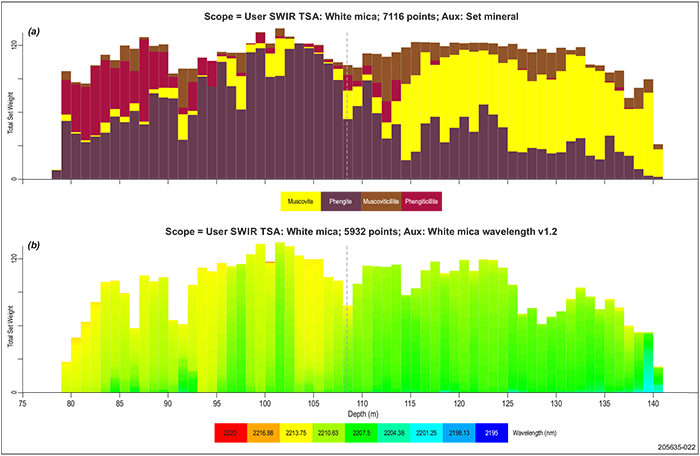
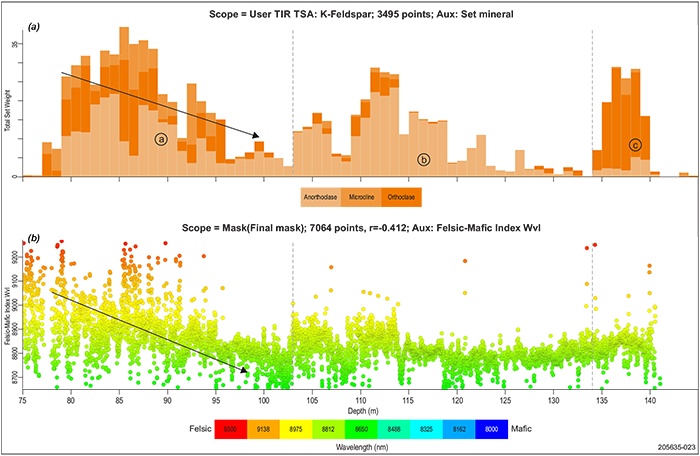
Subtle changes in white mica wavelengths between 2,190 and 2,225 nm were detected in several drillholes, most prominently in PPDH001 (Fig. 12) where intrusive rhyolite has mixed with the surrounding polymict breccia producing peperite. In this drillhole, the volcaniclastic–peperitic interval of the Bittali Rhyolite from 75 to 145 m shows a distinct distribution of white micas. The long wavelength (2,205–2,220 nm) white mica (phengite) is the dominant variety to ~113 m. A distinct change to aluminium-rich white mica (muscovite) occurs from ~108 m and represents a change within that unit related to the variability of mixing between the rhyolite and the polymict breccia producing 2 distinct mineralogical intervals. The interval from 75 to 113 m appears to be dominated by rhyolite with minor mixing with the breccia producing some peperite intervals identified by the presence of muscovitic illite (marked by a large spectral water feature around 1,900 nm, compared to the surrounding breccia). The interval from 113 to 145 m appears to be increasingly mixed and dominated by peperite texture with fewer intersections of unmixed breccia. The white mica wavelength scalar developed by CSIRO (Wells et al. 2016) also reveals subtle changes within this volcaniclastic–peperitic unit. In an attempt to determine the relative amounts of polymict breccia and rhyolite in the peperitic mixture, the relative abundance of potassic feldspar was compared to a histogram of the felsic–mafic index wavelength (FMI) (Fig. 13). The FMI tracks the peak wavelengths between 7,500 and 1,1500 nm to differentiate lithological changes between felsic units (such as rhyolite which has longer wavelengths and a higher FMI value) and mafic units (volcaniclastics with shorter wavelengths and lower FMI values). In PPDH001, the FMI shows a downward slope in the upper 20 m (~75–95 m) corresponding to a decrease in potassic feldspar content. The variation in the FMI reflects lithological changes with higher potassic feldspar and FMI relating to amount of rhyolite in the peperitic mixture (Fig. 14a). Where potassic feldspar and the FMI are relatively flat lying (~95–103 m and ~115–135 m) it is interpreted as being equally mixed (Fig. 14b). There is a small increase in the FMI between 103 and 115 m, representing a slight increase in felsic components and thus less mixing with the volcaniclastic breccia. There is, however, a significant increase in potassic feldspar at 135 m while the FMI displays only a slight increase. This is interpreted to be the interaction with hotter, potentially ore-bearing fluids at the base of this unit that caused the recrystallisation of fine-grained microcline to coarser orthoclase, thereby dominating the spectral response (Fig. 14c).
Figure 12 PPDH001 volcanic interval, 75–145 m. (a) Distribution of white micas. (b) Subtle changes in the white mica wavelength between the upper and lower half of the volcanic unit.
Figure 13 PPDH001 volcanic interval, 75–145 m. (a) Distribution of potassic feldspar. (b) Changes in FMI clearly showing a slope towards more volcanic compositions from ~100 m. Circled letters show the location of the images in Figure 14.
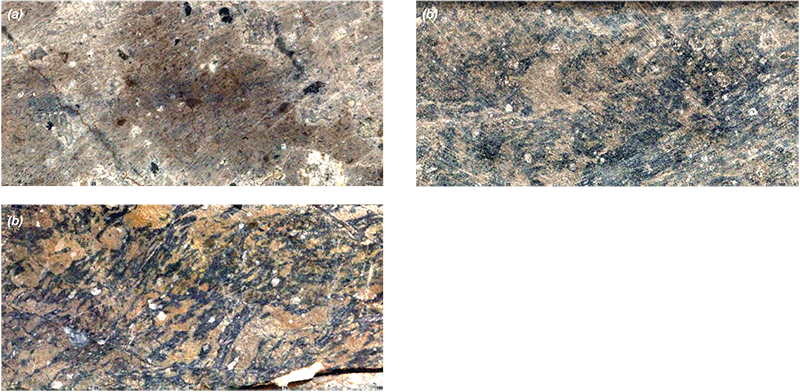
Figure 14 PPDH001 (scale mm). (a) Upper rhyolite-rich interval, ~75–100 m (image from 90 m). (Photo 418731) (b) Lower evenly mixed volcanic unit and rhyolite with microcline, ~100–135 m (image from 117 m). (Photo 418732) (c) Peperitic texture from the base of the volcanic unit, where orthoclase is the dominant feldspar, ~135–145 m (image from 138 m). (Photo 418733) Images are located on Figure 13.
Carbonates and layering in the Katunga Dolomite
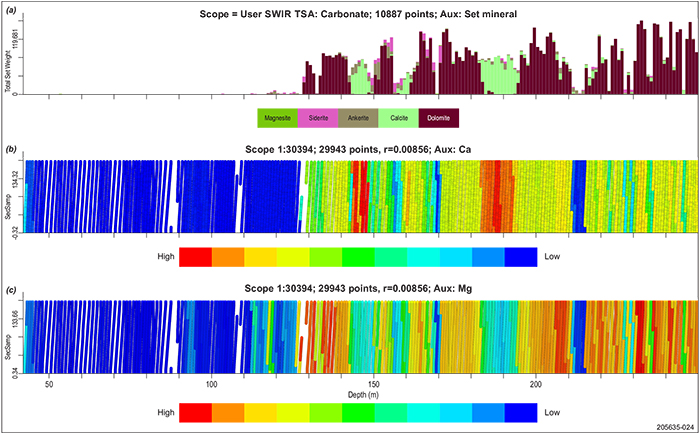
The carbonate-rich basement unit consists of layered to massive, white to grey marble. Spectral scanning has been an excellent tool to discern compositional layering within the unit, best seen in PPDH023 and PPDH039. The layers within the marble are defined by alternating dolomite- and calcite-dominated intervals which are validated by assay values for calcium and magnesium (Fig. 15). Layering in the marble is more prominent around the margins of the deposit and can be traced between PPDH023 (western end of line 7) and PPDH039 (eastern end of line 7). The majority of cores contain massive dolomite marble.
Figure 15 PPDH023, 40–250 m. (a) Distribution of thermal infrared identified carbonates. (b) Assay values for calcium. (c) Assay values for magnesium. The assays confirm the identification of calcite- and dolomite-rich layering identified in the spectral data, both visually difficult to distinguish.
The intensity of calc-silicate alteration varied across line 7, with low alteration identified as tremolite, talc and actinolite, and high-grade alteration dominated by serpentine and diopside, with garnet in some instances. Spectral mineralogy and classification was used to rapidly log the intervals of intense alteration. The calc-silicate footprint changes from low-grade alteration dominating the western end of line 7 to high-grade alteration towards the eastern end of the deposit. The most intense high-grade alteration zones were associated with felsic intrusives towards the eastern end of the line.
Conclusion
Along line 7 of the Paris deposit the mineralised intervals lie above the metasedimentary rocks of the Hutchison Supergroup, in the overlying volcaniclastic units of the lower Gawler Range Volcanics. Hyperspectral characterisation of a series of drill cores along line 7 of the deposit revealed subtle variations in mineralogy linked to variations in lithology and alteration of these rocks. This study demonstrated the usefulness of hyperspectral analysis in the characterisation of lithology through intense alteration associated with an epithermal-style mineral deposit. In particular, spectral results provided clarification and logging of lithologies across the line. Twelve distinct spectral units were defined by the presence or absence of minerals and compared to the original geological logs (Appendix).
Most notably, several spectral calculations were used to delineate these subtle variations within the upper volcanic sequences of the lower Gawler Range Volcanics. Tschermak’s substitution of iron and aluminium in the phyllosilicate structure of white micas (wavelength variations between 2,220 and 2225 nm) was used to delineate differences within the overlying volcanics and in conjunction with other spectral mineral distributions (feldspars). These parameters were then used to map the relative amount of mixing between volcanic breccias and rhyolitic intrusives along line 7 to identify the peperitic rocks. Layered carbonate rocks (dominated by dolomite) in the basement metasediments of the Hutchison Supergroup were also difficult to visually classify. Here the spectral scalars (using thermal infrared wavelengths at 14,000 and 11,300 nm) were used to rapidly identify these layers within this unit and verified by the geochemical results for calcium and magnesium. The ability to discern the original layers in the altered carbonate allows rapid logging of the original layering that is not visually discernible and potential use of the information as marker horizons across the deposit.
Calc-silicate alteration associated with the emplacement of felsic intrusives was classified into low-grade alteration (dominated by tremolite, talc, and actinolite), and high-grade alteration (serpentine and diopside).
Appendix
Correlation of Investigator Resources’ lithological units to the 12 spectral mineral domains identified for line 7 drillholes, Paris deposit.
Download the appendix (XLSX, 835.5 KB)
Acknowledgements
John Anderson, Andrew Alesci and Jason Murray (Investigator Resources) are acknowledged for their cooperation with investigations, including sharing their ideas on the geology and assisting with the provision of samples outside the scope of the original investigation. We also wish to thank Mario Werner and Adrian Fabris (Geological Survey of South Australia) for their reviews of this paper.
References
Caruso AS, Clarke KD, Tiddy CJ and Lewis MM 2021. Airborne hyperspectral characterisation of hydrothermal alteration in a regolith-dominated terrain, southern Gawler Ranges, South Australia. Australian Journal of Earth Sciences 68(4):590–608. doi:10.1080/08120099.2020.1826122.
Corbett GJ and Leach TM 1998. Southwest Pacific Rim gold-copper systems: structure, alteration, and mineralization, Special Publication 6. Society of Economic Geologists. doi.org/10.5382/SP.06.
Green D and Schodlok M 2016. Characterisation of carbonate minerals from hyperspectral TIR scanning using features at 14 000 and 11 300 nm. Australian Journal of Earth Sciences 63(8):951–958. doi:10.1080/08120099.2016.1225601.
Paul MW, Cook NJ, Ciobano CL, Anderson J and Murray J 2015. Preliminary mineralogical investigations of the Paris silver deposit, northern Eyre Peninsula, South Australia. In Mineral Resources in a Sustainable World – 13th SGA Biennial Meeting, 2015, Proceedings Volume 1. Society for Geology Applied to Mineral Deposits, pp 185–188.
Pontual S, Merry N and Gamson P 1997. Regolith logging in G-MEX Vol. 8. AusSpec International Pty Ltd, Melbourne.
Szpunar M, Hand M, Barovich, K, Jagodzinski E and Belousova E 2011. Isotopic and geochemical constraints on the Paleoproterozoic Hutchison Group, southern Australia: implications for Paleoproterozoic continental reconstructions. Precambrian Research 187:99–126. doi:10.1016/j.precamres.2011.02.006.
Vassallo JJ and Wilson JL 2001. Structural repetition of the Hutchinson Group metasediments, Eyre Peninsula, South Australia. Australian Journal of Earth Sciences 48:331–345. doi:10.1046/j.1440-0952.2001.00859.x.
Wells M, Laukamp C and Hancock L 2016. Reflectance spectroscopic characterisation of mineral alteration footprints associated with sediment-hosted gold mineralisation at Mt Olympus (Ashburton Basin, Western Australia). Australian Journal of Earth Sciences 63(8):987–1002.


