Anna Petts and Baohong Hou
Geological Survey of South Australia, Department for Energy and Mining
Download this article as a PDF (1.5 MB); cite as MESA Journal 94, pages 66–76
Published June 2021
Contents
Introduction
Geology
Drillholes analysed
Analytical methods
Quality assurance and quality control
Results
Discussion
Further work
References
Introduction
The Delamerian National Drilling Initiative (NDI) is being run by the Geological Survey of South Australia as part of the MinEx CRC. The program has highlighted the mineral potential of the Delamerian Orogen that extends beneath sediments of the Murray Basin in eastern South Australia. Mineral exploration programs in this region need to understand and utilise the geology and geochemistry of the cover sediments. For this reason, a review of known cover geology and regolith, plus geochemistry, has been initiated to assist exploration and for planning drillholes for the NDI.
Downhole geochemistry is very sparse for existing drillholes in the Delamerian NDI areas. Many were drilled for petroleum exploration and have not been analysed for metal content. To fill this gap we have produced a systematic downhole portable X-ray fluorescence (pXRF) geochemical dataset within sedimentary packages from selected drillholes.
In this article we report the results of downhole pXRF analysis using a handheld device and comment on the geochemical features of sedimentary cover and lithified and crystalline basement rock units in 3 drillholes. Further work is underway on other drillholes. The complete dataset will be available via the South Australian Resources Information Server (SARIG) as a data package, with a report containing all measured drillholes to be published mid-year 2021.
A detailed review of cover stratigraphy has been undertaken by Hou and Petts (2021, this issue) to ensure an up-to-date stratigraphic and lithological framework for the Delamerian NDI, as well as to better constrain the pXRF data generated in this study. This work will assist with exploration for commodities such as copper, nickel, gold, mineral sands, diamonds and groundwater resources.
Geology
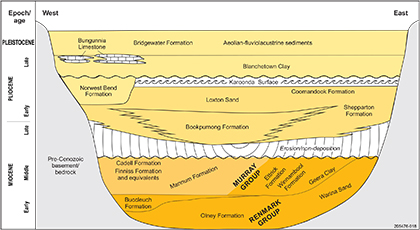
Figure 1 shows the general cover and basin stratigraphy expected in the northern Delamerian NDI area, Quondong Vale. All the sampled drillholes intersect some of the stacked basin sediments, including units shown in Figure 2. These are:
- Late Pliocene to Pleistocene Blanchetown Clay
- Late Miocene to Early Pliocene Loxton Sand
- Late Miocene to Early Pliocene Bookpurnong Formation
- Early to Middle Miocene Mannum Formation and Gambier Limestone (Cooltong 1; SA Geodata drillhole 127802)
- Mid Oligocene to Middle Miocene Murray Group including Winnambool Formation
- Late Oligocene to ?Early Miocene Ettrick Formation (lower Murray Group; deliberately split out and defined in the downhole pXRF logs)
- Late Paleocene to Early Oligocene Renmark Group
- Early Cretaceous Coombool, Merreti and Pyap members of the Monash Formation
- Permian Urana Formation
- undifferentiated Devonian rocks.
Figure 1 Simplified stratigraphic section of the Murray Basin showing the major Neogene stratigraphic units across the Murray Basin (modified from Brown and Stephenson 1991; Miranda et al. 2009).
Drillholes analysed
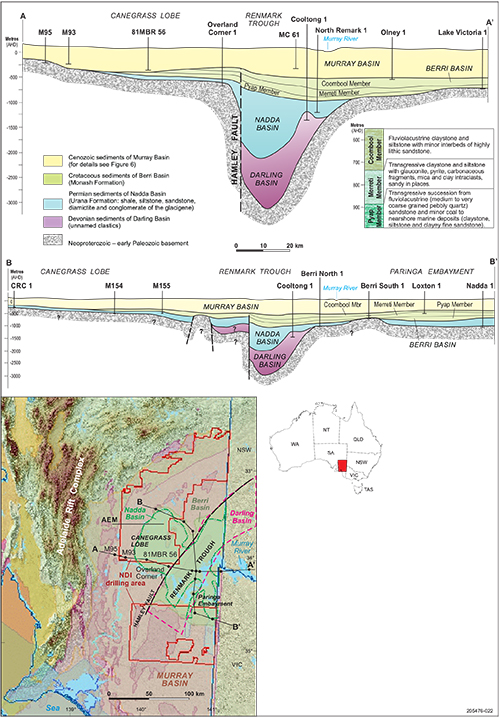
Analyses were carried out at the South Australia Drill Core Reference Library. The drillholes analysed in this article – Loxton 1 (126322), Cooltong 1 and Overland Corner 1 (103464) – include Murray Basin and underlying Renmark Trough sediments. Drillholes to be included in the final report go much deeper into the Darling, Nadda and Berri basin sediments, with some finishing in Paleozoic and Neoproterozoic basement. The geology and stratigraphy of these drillholes are detailed in Hou and Petts (2021; Table 1).
Table 1 Stratigraphic nomenclature for the cover sediments in the NDI area
| Age | Unit | Domain |
|---|---|---|
| Holocene | Recent alluvium; regolith | Murray Basin |
| Late Pliocene to Pleistocene | Bridgewater Formation; upper Norwest Bend Formation; Bungunnia Limestone; Blanchetown Clay; Coomandook Formation; Chowilla Sand | Murray Basin |
| Late Miocene to Early Pliocene | Karoonda Surface; Loxton Sand; Norwest Bend Formation; Bookpurnong Formation | Murray Basin |
| Late Early Oligocene to Middle Miocene | Murray Group – Cadell Formation, Finniss Formation and equivalents, Geera Clay, Ettrick Formation, Winnambool Formation and Mannum Formation; Gambier Limestone (Cooltong 1); Olney Formation (upper Renmark Group) | Murray Basin |
| Late Paleocene to Early Oligocene | Ettrick Formation (lower Murray Group); Renmark Group – Buccleuch Formation, Olney Formation and Warina Sand | Murray Basin |
| Early Cretaceous | Monash Formation – Coombool, Merreti and Pyap members | Berri Basin |
| Permian | Urana Formation – shale, siltstone, sandstone, diamictite and conglomerate of the glacigene | Nadda Basin |
| Late Silurian to Early Carboniferous | Largely continental redbed facies but probably include marginal marine facies, current‑bedded sandstone, grey‑brown to green shale and slightly carbonaceous, micaceous siltstone | Darling Basin |
| Neoproterozoic to early Paleozoic | Adelaidean strata or Kanmantoo Group | Basement |
Analytical methods
Assay readings
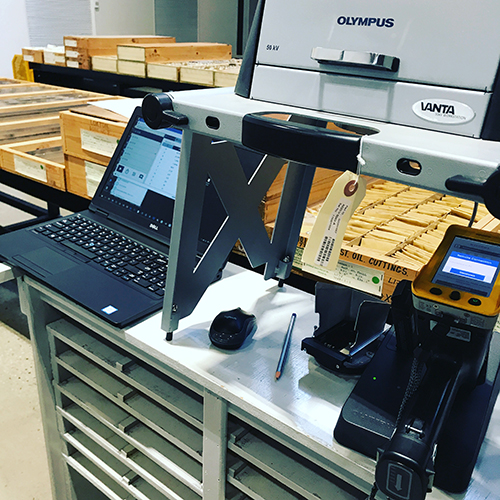
An Olympus Vanta M-series pXRF (50 kV X-ray tube fitted with a beryllium large area silicon drift detector) was used in a stand operating for a total of 50 s (25 s for each of 2 beams of different energy levels). The instrument was operated in ‘geochem’ mode, all samples and standards were covered by a 6 µm thick polypropylene film or taken through a plastic sample bag. Measurements are controlled from a laptop, using the Vanta desktop app. The stand was especially useful due to the nature of the samples – unconsolidated chips and sand within plastic storage bags, plastic storage vials or glass vials (Fig 3). Core was analysed if available.
Figure 3 Setup for downhole pXRF analysis of drill samples at the Core Library. (Photo 418362)
The standard procedure for preparing the samples was to:
- check sample interval against the spreadsheet and enter the interval into the Vanta app (if not already updated)
- decant the bag onto a clean, thin clear plastic sheet (if a large amount) directly over the device window in the stand
- or, if in a vial already, use a thin plastic film and plastic circular holder to allow the vial to be tipped upside down and placed directly over the device window in the stand
- record new sample interval in the Vanta app, if not already updated
- start the analysis using the Vanta app
- after a beam time each of 25 s, update the beam spectra and photo
- decant sample back into the vial or bag and reseal.
The varying degrees of container interference with X-ray beams when using a pXRF device, in particular a Vanta M series, is discussed in Gazley and Wellnitz (2019). X-ray transmission modelling can be undertaken to quantify the effect of different materials used to contain samples to predict the likely effect of the sample container chosen. The polypropylene window on the pXRF instrument is 4 µm thick to enable an abundance of primary X-ray beam to reach the sample and the fluorescence to then get back to the detector.
This study took assay readings using 3 or 4 types of sample containers to analyse the cover material, which is mostly unconsolidated. Decanting into a container for measuring was decided to be too risky for contamination of the small cutting samples, and therefore it was decided to use the existing sample container for analysis. Two of the holes were decanted from glass jars to a sheet of thicker plastic sample bag provided by the Core Library. To quantify interference on the readings for the downhole material, the plastic bag was also analysed by the Vanta device. Some drillhole samples were stored in plastic bags and therefore samples were analysed directly in the bag. Other drillhole samples are stored in plastic jars which conveniently fit the cup rings normally used for pellets. The coincidental compatibility of the cup ring and thin plastic film with the Vanta device meant that these samples could be easily analysed simply by turning jars upside down over the Vanta window in the Olympus stand (Fig 3).
Downhole analysis
Imdex’s ioGAS™ software was used to statistically analyse and plot the downhole assay data. As downhole data was imported into ioGAS, the software decided on certain parameters of the data including:
- import threshold (% greater than detection limit)
- detection limit value
- concentration vs error plots.
A general rule for using pXRF geochemical data for analysis is that at least 70% of the data for each variable should be above the detection limit. This value is the default threshold used within ioGAS; however, it can be changed manually. All variables which have the required percentage of data above the calculated detection are flagged for import. Variables outside of the selected import threshold percentage can still be imported by checking the import box manually. The detection limit is the detection limit value that has been assigned for each element. By default, ioGAS populates the detection limit value using the REFLEX Vanta VMR (40) levels of detection.
The detection limit of an element is determined by the length of measurement time (e.g. 1 min per sample), the physical matrix effects (e.g. particle size and homogeneity) and chemical matrix effects (e.g. the concentration of any interfering elements; Gazley and Wellnitz 2019). For a pXRF instrument, the detection limit provided by the instrument is typically 3 standard deviations from the mean concentration of that element. A reading from the pXRF of less than the reported error means the element is not present in a detectable quantity within the sample. A pXRF reading more than 3 times the reported error means that the value is deemed quantifiable and can be used as a dependable estimation of the abundance of that element in the sample (Brand and Brand 2014).
Downhole assays and geology
Once successfully imported into ioGAS the next step is to select variables and assign shapes and colours to the variables. These allow better visualisation of geological variation downhole as XRF assay data is reviewed. Set colours were used for stratigraphic units, and legends are provided with each downhole profile set of plots. Both the XRF assay readings (black line) and detection limit (red line) for each element are included on the downhole plots.
Quality assurance and quality control
Certified reference materials have been used at the beginning and end of the XRF assay procedure for all drillholes used in this study. Also, some certified reference material readings were taken during assaying of the deeper drillholes. These have all been analysed at commercial labs, but their pXRF readings have not been quantitatively assessed. This will be undertaken in follow-up work to allow for averaging of the data and general use in future programs.
Results
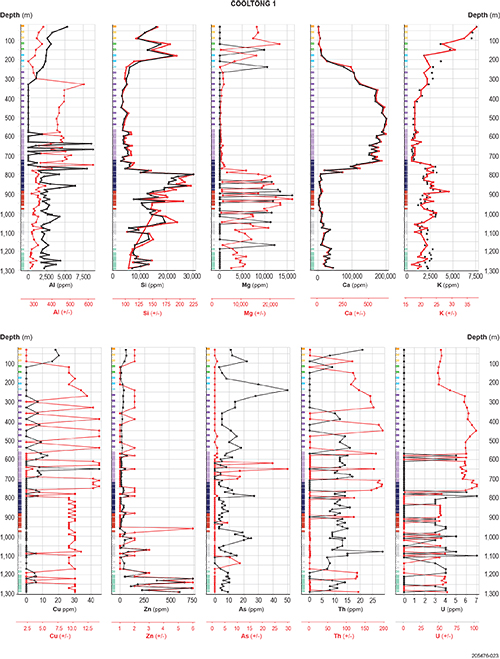
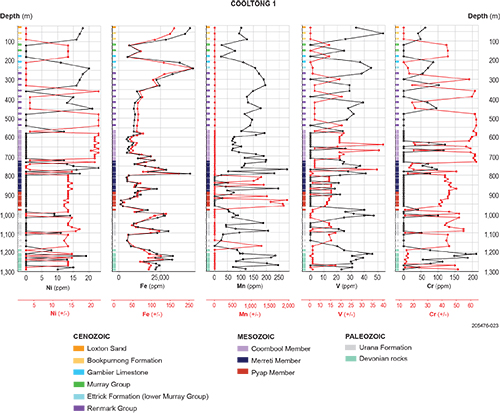
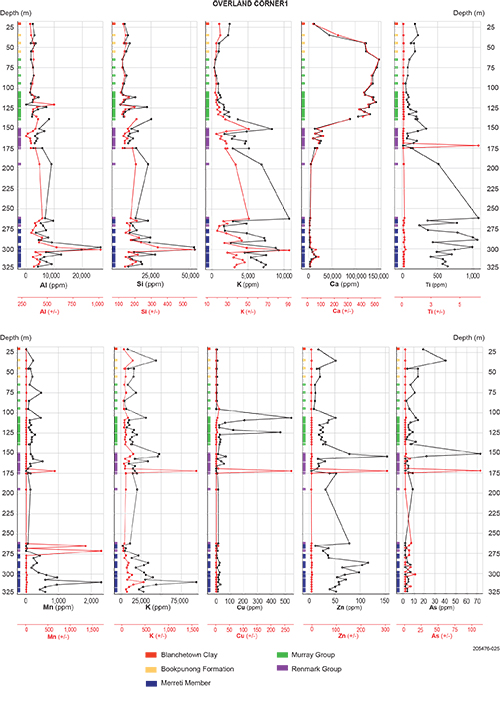
Plots for the 3 drillholes included in this article are shown in Figures 4–6. Both the reading and detection limit are provided for the analytes of interest. Table 2 provides a summary of the analytes for which the pXRF data is considered to have produced reliable geochemical assays.
Loxton 1
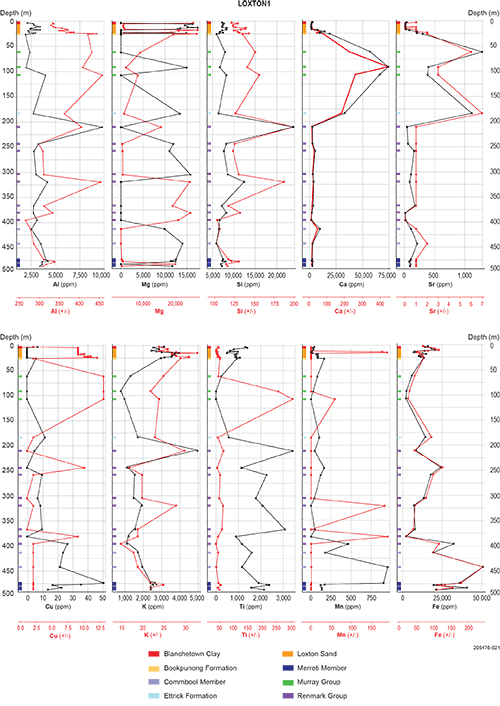
Loxton 1 was analysed to 480 m depth across 8 stratigraphic units (Fig 4). Sixteen elements are above detection limit. Nineteen additional elements had values recorded but the data was considered too inaccurate to include.
Magnesium, Cu, Ti, and Fe are above detection limit for the most part, with the transition from the limestone-rich formations within the broader Murray Group to the Ettrick Formation (lower Murray Group). This is marked by a spike in Al, Cu and K and decrease in Mg. The Renmark Group sediments are relatively elevated in Cu and Ti; however, Cu increases to up to 50 ppm in the basal unit, the Merreti Member, in this drillhole. This also corresponds with a spike in Mn.
Figure 4 IoGas plots of downhole pXRF results for Loxton 1.
Cooltong 1
Cooltong 1 was analysed to 1,300 m depth across the featured stratigraphic units (Fig 5). The sample interval varied from 30 m interval (near surface) and 10 m intervals (at 500–960 m and at deeper depths).
Thirty-four elements were measured with 24 elements above detection limit. Copper, As, Th, U, Ni, Mn, V and Cr show measured values sometimes above detection limit and often below detection limit across all units. There is a spike in Cu at 650 m within the Coombool Member, which also corresponds to a spike in Al.
Figure 5 IoGas plots of downhole pXRF results for Cooltong 1.
Overland Corner 1
Overland Corner 1 has been analysed to 325 m depth across 5 stratigraphic units (Fig 6). Sample intervals were 30 m at top of hole and closer in sections in the middle and bottom of hole.
Nineteen elements were detected, with the main 10 elements of interest discussed here. For analytes Al, Si, K, Ca, Ti, Mn, Fe, Cu, Zn and As, most downhole samples analysed are above detection limit. Blanchetown Clay and Bookpurnong Formation have low abundance of Al, Si, K and Ca, with some variation downhole. Elements Ti, Mn, Fe and As are above detection limit in these top 2 units, with a spike in Zn near the unconformable contact between them.
The limestone-dominant Murray Group sediments also have close to detection limit levels of Al, Si, K and Ca, and moderate amounts of Ti, Zn and As. Copper is significantly elevated at 100 m depth, within the Murray Group sediments, which also corresponds with a smaller peak in Zn.
Within the Renmark Group, Ca and As are close or within detection limit. Both Al and Si decrease to the base of the unit and K, Ti, and Zn increase considerably.
The deepest unit assayed was the shallow marine Merreti Member. Sampling density appears to assist in measuring geochemical variation within the units, especially for Al, Si and K, although these elements are close to detection limit. For both Mn and Fe, detected values increase to bottom of the drillhole while for Zn, values decrease.
Figure 6 IoGas plots of downhole pXRF results for Overland Corner 1.
Table 2 Elements which were effectively measured using the pXRF in this study (3 x detection limit or more)
| Stratigraphic unit | Description | Element* Overland Corner 1 | Element* Loxton 1 | Element* Cooltong 1 |
|---|---|---|---|---|
| Blanchetown Clay | Clay, greenish grey, sandy; limestone, thin; quartz sand; clay, green-grey, mottled, sandy. | Ti, Fe, Zn, As, Rb (Al, Si, K, Ca, Cu, Sr) | Ti, As | Al, Cu, As, Ni, Mn, V, Cr |
| Loxton Sand | Sand, glauconitic, micaceous, and shelly gravel; Coarse-grained sand and fine gravel, and calcareous micaceous, medium- to coarse-grained sandstone. Shallow marine, beach, aeolian, lacustrine and fluvial. | — | Ti, As | Al, Cu, As, Ni, Mn |
| Bookpurnong Formation | Marl; silty clay; minor fine-grained sand, glauconitic. Shallow marine. | Mn, Fe, Zn, As, Rb, Sr (Al, Si, K, Ca, Ti, Cu) | Ti, As | — |
| Winnambool Formation (Murray Group) | Marl, fossiliferous; glauconitic marly limestone; marly clay. Shallow water, restricted marine and lagoonal. | — | — | — |
| Murray Group | Limestone, echinoidal, bryzoal, crinoidal; sandstone, calcareous; minor carbonaceous clay and silt. | Cu, Zn, As (Al, Si, K, Ca, Ti, Mn, Fe, Rb, Sr) | Mg | Al, As, Ni, Mn |
| Gambier Limestone (Cooltong 1) | Limestone, bryzoal, grey-cream, dolomitic in part, minor glauconite. | — | — | Al, As, Ni, Mn, V |
| Ettrick Formation (lower Murray Group) | Glauconitic, fossiliferous marl; calcareous clay and mudstone; silt; fine-grained sand. | — | — | As, Ni, Mn |
| Renmark Group | Sandstone, carbonaceous sand; silt; clay; lignite. Fluvial, lacustrine and swamp environments. | K, Ti, Fe, Zn, As, Rb (Al, Si, Ca, Mn, Cu, As, Sr) | Al, Mg, As, S | Mg, As, Mn, V |
| Coombool Member | Sandstone, interbedded fine to very fine grained, green-grey; grey quartzose and carbonaceous siltstone; grey soft sticky clay. | — | Cu, Ti, Mn, As, Ni | Al, Cu |
| Merreti Member | Shale and mudstone with interbeds of siltstone and very fine to fine grained sandstone, glauconitic, micaceous, carbonaceous. | Ti, Mn, Fe, Zn, Rb (Al, Si, K, Ca, Cu, As, Sr) | Mg, Cu, Ti, Mn, As, Ni | Al, Ni |
| Pyap Member | Sandstone, friable; minor interbeds of claystone and silty argillaceous sandstone; minor coal associated with glauconitic sandstone. | — | — | Al |
| Urana Formation | Shale, green-black, soft-brittle, fissile, micaceous in part; interbedded sandstone, medium-coarse grained, lithic fragments, white clay matrix. | — | — | Al, As, V |
| Devonian rocks | Interbedded sandstone, fine-coarse grained, white-yellow-brown, quartzose; siltstone, dark red-brown, non-calcareous; claystone, black-red, finely bedded and shaley; rare green-black shale. | — | — | Mg, Mn, V, Cr |
* Elements in brackets are below detection limit.
Discussion
In all the drillholes, the pXRF was able to detect lithologically controlled chemical variation. For example, Ca shows consistent correlation with limestone abundance, and variations in limestone within units can also be determined on the basis of the pXRF data.
Overland Corner 1 features elevated Cu at about 100 m depth within the limestone-rich Murray Group. This stratigraphic unit has been logged by Hou and Petts (2021) and Rogers et al. (1995) as a calcareous sandstone with minor carbonaceous clay and silt, fossiliferous and trace glauconitic. Pyrite occurs towards the bottom of the Murray Group. Zinc and As are also elevated within the lower Murray Group. Below this unit, within the Renmark Group sediments, Ti and K are elevated. Sediments within the Merreti Member feature elevated As, Fe and Zn – perhaps due to the presence of micaceous material within the shale and mudstone interbedded with sandstone, which defines this stratigraphic unit.
The measurements of Cu and Mn in Loxton 1 show a similar pattern downhole, with a spike in both elements within the Coombool Member, which contains sandy, clayey/silty and lignite rich units as well as pyrite (Hou and Petts 2021). Titanium and As are mostly above detection limit downhole, and these elements may be useful markers for stratigraphic horizons within the Coombool Member, potentially enabling correlations across the basin.
Cooltong 1 also displays similar spikes in Cu and Mn in the Coombool Member and possibly associated with pyritic bands and regolith minerals within the silt, clay and sand rich unit. The measurements for As, Ni and V are also compelling, and show a pattern across the intercepted stratigraphic units. The higher levels of V, Ni and Cr are measured within the Devonian rocks and may be associated with rock forming minerals; however, this association requires further investigation. Arsenic is particularly elevated in the marginal marine Late Oligocene to ?Early Miocene Ettrick Formation, which is characterised as a clayey limestone with interbedded clay and calcareous, glauconitic shelly fragments (Hou and Petts 2021). Major elements such as Si, Mg, Ca, and K show variations downhole that correlate with stratigraphy. For example, increase in Ca and decrease in Si from clastic upper units into the limestone-dominated units of the Gambier Limestone, Ettrick Formation and Renmark Group rocks.
Many elements were below detection limit. However, this could be improved if multiple readings were made at each interval as opposed to the single reading applied in this study. Variability of detection limit for many elements is also strongly controlled by the variable nature of the sample itself – whether washed cuttings or unwashed cuttings, as well as sample size (many samples were very small and therefore the pXRF would have an increase in backscatter).
Further work
These results will be utilised to plan downhole logging procedures in future exploration initiatives such as the Delamerian NDI. The ability to rapidly collect pXRF data from drilled and sampled sediment and rock units from surface will benefit our understanding of downhole geochemical character.
The testing of pXRF assaying on downhole cuttings, core and retained samples has definitely pushed the limitations of the Olympus Vanta device. The variety of containers the samples have been kept in, as well as the differences in sample media (washed, unwashed, core) means that this dataset can be a useful reference for future pXRF campaigns. Spikes in measured analytes show that the pXRF device can detect elements of interest in very small samples, even with a single assay. Therefore, it is important to recognise the potential use of downhole pXRF in first pass downhole geochemistry studies. The portability of the device allows use alongside a drilling rig, and we look forward to testing the device in our upcoming Delamerian NDI program in 2021.
The geochemical responses measured downhole in this study appear to be related to mineralogy, and therefore controlled by facies change and sediment provenance. There is further work to be done to pull together the stratigraphic review by Hou and Petts (2021) and the zircon provenance study of Köhler et al. (2020) to provide a full picture of geochemical dispersion in the Murray Basin and cover sediments in the Delamerian NDI region.
Acknowledgements
Staff at the South Australia Drill Core Reference Library are acknowledged for their patience and assistance finding and displaying cores. Thanks to Geological Survey of South Australia (GSSA) colleagues Carmen Krapf, Adrian Fabris, Rian Dutch and Liz Jagodzinski for their input and assistance with using the pXRF device and other petrophysics work. Thanks also to the reviewers – Anthony Reid (GSSA), Mitchell Bockmann (University of Adelaide) and Simon Bailey (Olympus Australia).
References
Brand NW and Brand CJ 2014. Performance comparison of portable XRF instruments. Geochemistry: Exploration, Environment, Analysis 14(2):125–138. doi:10.1144/geochem2012-172.
Brown CM and Stephenson AE 1991. Geology of the Murray Basin, southeastern Australia, Bulletin 235. Bureau of Mineral Resources, Geology and Geophysics, Australia.
Gazley MF and Wellnitz K 2019. X-ray transmission and pXRF: implications for the analysis of geological samples through different media. Geochemistry: Exploration, Environment, Analysis 19(4):343–346. doi:10.1144/geochem2018-058.
Köhler H 2020. Zircon provenance and sedimentary transport processes – implications for the late Neogene evolution and heavy mineral deposits of the western Murray Basin, South Australia. Master thesis, Technische Universität Bergakademie Freiberg, Freiberg.
Miranda JA, Wallace MW and McLaren S 2009. Tectonism and eustasy across a Late Miocene strandplain: the Loxton-Parilla Sands, Murray Basin, southeastern Australia. Sedimentary Geology 219:24–43. doi: 10.1016/j.sedgeo.2009.03.012.
Morris PA 2009. Field-portable X-ray fluorescence analysis and its application in GSWA, Record 2009/7. Geological Survey of Western Australia, Perth.
Stanley C and Lawie D 2008. Thompson–Howarth error analysis: unbiased alternatives to the large-sample method for assessing non-normally distributed measurement error in geochemical samples. Geochemistry: Exploration, Environment, Analysis 8(2):173–182. doi:10.1144/1467-7873/07-145


