
Greater Tarcoola area regolith and APY Lands palaeovalley maps released.
Regolith map of the greater Tarcoola area
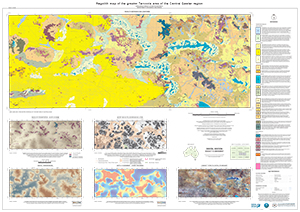
A new regolith map for the greater Tarcoola area of the Central Gawler region provides a consistent baseline dataset for guiding mineral exploration. It delivers a broadscale framework to assist with geochemical sampling and interpretation, as well as representing a useful dataset to address land use issues such as groundwater. Information on depth to basement – cover thickness is shown for the first time.
Compilation of this regolith and landform data contributes to a joint Geological Survey of South Australia (GSSA) and CSIRO project that develops new ideas and concepts for exploration through cover in the Central Gawler region. It is driven by the newly acquired data from the highly successful Gawler Craton Airborne Survey.
The new regolith map can be downloaded via the South Australian Resources Information Gateway (SARIG) as a PDF map product as well as a map layer dataset (located in the Geology – regolith layers).
Map compilation
Previous regolith map data for the greater Tarcoola area included the GSSA’s statewide regolith layer, and the four regolith maps of Bon Bon-Eba, Half Moon Lake, Eldoah Tank and Tunkillia areas, which were compiled in early 2000 as part of the Cooperative Research Centre for Landscape Environments and Mineral Exploration (CRC LEME). Other data available for the Central Gawler region varied in scale, detail and consistency.
The new regolith map covers the three 1:100,000 map sheets of MALBOOMA, TARCOOLA and KINGOONYA. It is based on the 1:100,000 state geology dataset using the regolith landform mapping (RTMAP) scheme published by CRC LEME in 2007 (Open File Report 231). Refinements include the use of remote sensing data – e.g. new Landsat 8 imagery and MrVBF (multi-resolution valley bottom flatness) – as well as new high-resolution digital elevation and radiometric data from the Gawler Craton Airborne Survey Regions 9A and 9B. Digital data was coupled with direct field observations of the study area, which provided vital ground observations.
Twenty-two regolith landform units are defined and characterised. Calcrete, silcrete and ferricrete regolith units are included as three separate induration or duricrust units. Polygon line work was compiled using ArcGIS 10.6.1. For each regolith polygon, nine attributes were captured during the mapping process including regolith material and landform name, description, RTMAP code and map symbol, as well as the TI (transported versus in situ) based on previous regolith mapping undertaken by the GSSA. This also includes information of the original geological map units from the 1:100,000 state geology dataset and their associated age.
Palaeovalley map of the APY Lands
The palaeovalley map of the Anangu Pitjantjatjara Yankunytjatjara Lands (APY), South Australia, shows the interpreted distribution of palaeovalleys that are hidden beneath the surface of the modern day sandplains, dunefields and creeks. It includes for the first time information about the location of the deepest part of the palaeovalley via thalweg mapping.
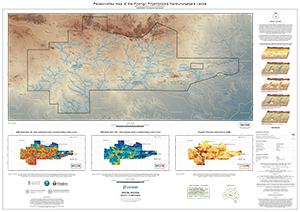
This broadscale map serves as a guide for more detailed future hydrogeological investigation to unlock additional groundwater resources.
The map was compiled using airborne electromagnetic (AEM) data and newly acquired drilling data from two selected hydrogeological control sites in the vicinity of the community of Kaltjiti (Fregon). It includes a schematic 3D model showing the evolution of the Lindsay East Palaeovalley through time based on detailed interpretation and analysis of the new drill core. Three inset maps provide information about the two AEM depth slices that image the top and the bottom of the palaeovalleys, as well as the regolith cover thickness derived from inverted AEM data.
The palaeovalley map can be downloaded via SARIG as a PDF map product as well as a map layer dataset (located in the Geology – palaeodrainage systems layers).
Background
The map was produced as part of the Goyder Institute for Water Research’s Facilitating Long-term Outback Water Solutions (G-FLOWS). Stage 3 of this project utilised new airborne electromagnetic (AEM) geophysical data collected in 2016 under the South Australian government’s PACE initiative.
G-FLOWS Stage 3 is a partnership between Department for Environment and Water, CSIRO, Flinders University, the Department for Energy and Mining and the GSSA. New and innovative geophysical and hydrogeological techniques developed in the previous two G-FLOWS stages, combined with a variety of field evaluation techniques including drilling, have been applied to map the palaeovalley groundwater resources in the APY Lands.
See previous articles on the drilling program (MESA Journal 90:23–35) and interpretation of results (MESA Journal 90:4–22).
– Carmen Krapf, October 2020
Jonathon Irvine (GSSA), Adrian Costar (formerly Department for Environment and Water), Tim Munday (CSIRO), Ignacio González-Álvarez (CSIRO) and Tania Ibrahimi (CSIRO) are acknowledged for their contribution to these new maps.