Rachelle Kernen1, Asmara Lehrmann2 and Piper Poe3
1 Australian School of Petroleum and Energy Resources, University of Adelaide
2 Department of Geological Sciences, University of Alabama
3 Pioneer Natural Resources
Download this article as a PDF (18.1 MB); cite as MESA Journal 95, pages 4–29
Published October 2021
Contents
Introduction
Geologic setting
Methods
Results
Discussion
Conclusion
Appendix
Acknowledgements
References
Introduction
The Neoproterozoic era was a pivotal interval of Earth history and the Ediacaran sedimentary succession of South Australia contains an unparalleled sedimentary record that includes complex early metazoan fossils, the Ediacaran fauna (Dunn et al. 1966; Cloud and Glaessner 1982; Gehling and Droser 2012). The fauna was first discovered in the Ediacara Hills (Nilpena Station, northeast Finders Ranges), after which the Ediacaran Period was named (Mawson and Sprigg 1950; Glaessner 1961; Jenkins 1981; Preiss 1983; Preiss 2000, 2005; Reid and Preiss 1999). This world-famous stratigraphic succession was impacted by major salt–sediment interaction throughout much of the Neoproterozoic and Cambrian time periods (Dalgarno and Johnson 1968; Lemon 1988; Rowan et al. 2020; Rowan and Vendeville 2006). Understanding the nature and timing of salt–sediment interaction is critical to interpret stratigraphic relationships and to facilitate paleoceanographic interpretations.
Salt–sediment interaction involves long-term, ongoing syntectonic deformation and sedimentation within affected sedimentary basins. This halokinesis is a critical factor in petroleum systems development and for determining potential sites for carbon and hydrogen storage in salt basins all over the world. Some of the salt basins are (but not limited to) the Gulf of Mexico, Brazil, West Africa and the North Sea (Diegel et al. 1995; Mohriak et al. 2008; Marton et al. 2000; Clark et al. 1999). With continued halokinesis, rock inliers are often incorporated into the evaporite body producing complex stratigraphic and structural relationships that are difficult to image using seismic reflection data in the subsurface (Helgesen et al. 2013; Huang et al. 2012; Li et al. 2011; Peles et al. 2004; Roy and Chazalnoel 2011). Because seismic imaging within and around salt bodies can be challenging, other stratigraphic tools are needed to determine the relative and absolute age of stratigraphic sections proximal to a diapir.
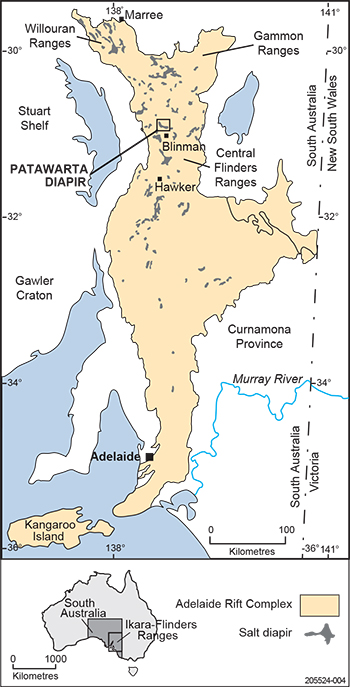
Figure 1 Location of the Adelaide Rift Complex showing major diapirs, including the Patawarta Diapir in the central Flinders Ranges (modified from Kernen et al. 2012; after Dalgarno and Johnson 1968).
In this paper we present a detailed petrographic, lithostratigraphic and chemostratigraphic analysis of anomalous sedimentary inclusions. Inclusions are rock or sediment ranging in size from centimetres to kilometres that are, at present, contained within a salt body or diapir and are composed of any lithology different to the main diapiric strata. Historically, inclusions are variously termed clasts, rafts, chips, stringers, sutures, floaters, flatters or encased minibasins. Patawarta Diapir, one of the major diapirs that disrupted the Ediacaran stratigraphic succession in the Flinders Ranges, South Australia, contains several large-scale, distinctive inclusions (Fig 1). Understanding the origin and age of the inclusions is required to interpret the salt tectonic history of the diapir and to understand how this affected the adjacent sedimentary basins. This methodology is applicable to determine the stratigraphic correlation of sediment inclusions in other diapirs where conventional biostratigraphic correlation is not possible (due to age, erosion, re-working). Unravelling complex stratigraphic relationships within diapirs will aid in developing a better understanding of the associated sedimentology, lithostratigraphy and paleoenvironment, as well as exploration and production concepts in petroleum systems and mineral deposits (sedimentary exhalative), and hydrogen storage potential.
Geologic setting
The Adelaide Rift Basin of South Australia developed through a series of continental rifting events as western Laurentia and Australia separated during the breakup of the Neoproterozoic Rodinia supercontinent (Sprigg 1952; Dyson 1996; Preiss 2000). The rifting trends north–south, extending almost 800 km northward from Kangaroo Island south of Adelaide through to the Flinders Ranges where it bifurcates to the northwest to the Willouran Ranges and northeast to the Gammon Ranges. The basin contains rift-fill sediments that were deposited contemporaneously with long-lived (>250 million years), widespread, passive salt diapirism (Forbes and Preiss 1987; Dyson 1996; Rowan and Vendeville 2006). After rifting ceased in the Cryogenian, a major episode of crustal shortening and metamorphism followed, known as the Delamerian Orogeny, which resulted in the inversion of the failed rift system during the late Neoproterozoic to Ordovician (c. 500 Ma; Preiss 1987). Shortening and inversion of the failed rift portion created the Adelaide Rift Complex (Fig 1; Forbes and Preiss 1987; Preiss 2000; referred therein as Adelaide Geosyncline).
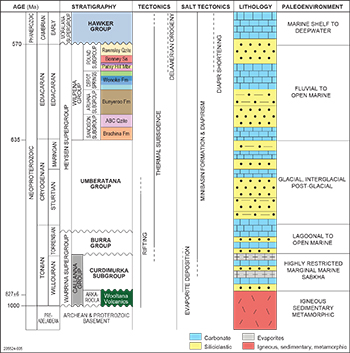
Figure 2 Precambrian–Cambrian stratigraphy, regional tectonics, salt tectonics, lithology and paleoenvironments of the Adelaide Rift Complex in the central Flinders Ranges (modified from Preiss 1987).
The Adelaide Rift Complex contains a thick succession of strata (up to 24,000 m thick) that provides one of the most complete sedimentary records of upper Proterozoic to Lower Cambrian strata in South Australia (Preiss 1987). The Willouran to Torrensian Callanna Group at the base of the rift sequence, above Archean and Proterozoic igneous and metamorphic basement (Fig 2), is about 130–8,400 m thick (Preiss 1987). The Callanna Group contains the layered evaporite sequence composed of evaporite, siliciclastic, carbonate (mostly dolomite), igneous and metamorphic rocks (Fig 2; Forbes and Preiss 1987; Dyson 1996; Preiss 2000). The Callanna Group was deposited in a highly restricted marginal marine sabkha during the early stages of rifting (Fig 2; Preiss 1987). It is overlain by the Torrensian to Sturtian Burra Group that is 3,000–8,000 m thick and composed of shale, siltstone, heavy mineral laminated sandstone and dolomite, representing the opening of the rift into a shallow ocean (Fig 2; Preiss 1987). Depositional facies of the Burra Group reflect the transition from restricted shallow marginal lagoons to an open marine shelf (Fig 2; Preiss 2000). It is overlain by the Sturtian to Marinoan Umberatana Group that is 6–10,000 m thick and composed of diamictite, conglomerate, sandstone, and laminated siltstone (Fig 2; Preiss 2000). The Umberatana Group was deposited in glacial, glaciomarine, interglacial and post-glacial marine shelf settings (Fig 2; Preiss 2000). It is overlain by the Marinoan Wilpena Group that is 40–7,000 m thick and composed of dolomite, limestone, calcareous sandstone, calcareous siltstone, siliceous siltstone, and shale (Fig 2; Preiss 1987). The Wilpena Group was deposited in an open marine, mixed siliciclastic and carbonate shelf with occasional nearshore and fluvial facies that correspond to topography created by the salt diapirs (Fig 2; Preiss 1987).
The Adelaide Rift Complex contains over 180 exposed diapirs (Fig 1; Dalgarno and Johnson 1968; Lemon 1988). Today’s exposed diapirs do not display halite or gypsum at the surface, but rather sedimentary and igneous inclusions that are surrounded by a diagenetic dolomicrite matrix. The diagenetic dolomicrite matrix surrounds pebble to kilometre scale inclusions of non-evaporite lithologies generally interpreted to be derived entirely from the Callanna Group layered evaporite sequence that was subsequently deformed, dismembered and carried with the evaporite during diapirism (Fig 2; Preiss 1987). Both inclusions and dolomicrite matrix are collectively mapped as ‘diapiric breccia’ (Preiss 1987). Mobilisation of the Callanna Group’s evaporites and initiation of passive diapirism in the Adelaide Rift Complex began as early as the Willouran (Fig 2; Dalgarno and Johnson 1968). Allochthonous salt forms sheet-like salt bodies emplaced at stratigraphic levels above the autochthonous source layer (Jackson and Talbot 1991). Allochthonous salt in the Adelaide Rift Complex was first recognised by Dalgarno and Johnson (1968) and further documented during deposition of the Burra, Umberatana, Wilpena and Hawker groups (Fig 2; Dyson1998, 2004, 2005; Lemon 1988; Hearon et al. 2010; Kernen et al. 2012; Hearon et al. 2015; Williams 2017; Rowan et al. 2020).
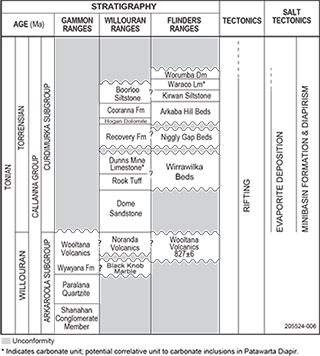
Figure 3 Stratigraphy, tectonics and salt tectonics of the Tonian Callanna Group layered evaporite sequence in the Gammon, Willouran and Flinders ranges (modified from Preiss 1987). Callanna Group strata are in their original layered evaporite sequence in the Gammon and Willouran ranges but in the diapirs as inclusions in the Flinders Ranges.
The autochthonous salt layer is one that rests in its original depositional position by which it accumulated by evaporation (Jackson and Talbot 1991). Autochthonous layers of the Callanna Group layered evaporite sequence are preserved in the Willouran and Gammon ranges (Fig 1). The lower part of the Callanna Group, referred to as the Arkaroola Subgroup (Fig 2), outcrops primarily in the Gammon Ranges near Mount Painter and Arkaroola. Within the Arkaroola Subgroup, the Wooltana Volcanics located in the Gammon and Flinders ranges has been radiometrically dated at 827 ± 6 to 830 ± 50 Ma (Fig 2; Preiss 1987). The relatively younger part of the Callanna Group is called the Curdimurka Subgroup, which outcrops in the Willouran Ranges (Fig 2; Preiss 1987). Preiss (1987) states that, in the Flinders Ranges, autochthonous exposures of the Callanna Group layered evaporite sequence are not present. The Callanna Group stratigraphic units are present in the area, but exclusively preserved as intrasalt inclusions within the diapiric breccia (diapiric to allochthonous salt) in the Flinders Ranges. Because the inclusions are no longer in their original depositional position (autochthonous), stratigraphic correlation from the entire Flinders Ranges diapiric Callanna Group to the autochthonous Callanna Group layered evaporite sequence in the Willouran and Gammon ranges is problematic (Fig 1; Preiss 1987). Due to our inability historically to correlate the Callanna Group stratigraphy from the Willouran and Gammon ranges to the Flinders Ranges, different names have been assigned to stratigraphic age-equivalent units (Fig 3; Preiss 1987).
Within the autochthonous Callanna Group stratigraphy, few carbonate units have been documented (Fig 2). The Dunns Mine Limestone has been documented in the Willouran Ranges and the slightly younger Waraco Limestone in the Flinders Ranges (Preiss 1987). The Dunns Mine Limestone varies between 50 to 200 m in thickness and is composed of dark grey dolostone interbedded with beds of calcareous shale and siltstone and lenses of sandstone (Murrell 1977). Additionally, chalcedonic nodules are found in the dolomite of the lower part of the section (Murrell 1977). The Waraco Limestone is composed of pale grey to cream stromatolitic dolostone and calcitic to dolomitic marble (Preiss 1987). The paucity of limestone in the Callanna Group stratigraphy is significant because this contrasts to large silty limestone inclusions that are common in the Patawarta Diapir identified in this study.
Previous work – Patawarta Diapir
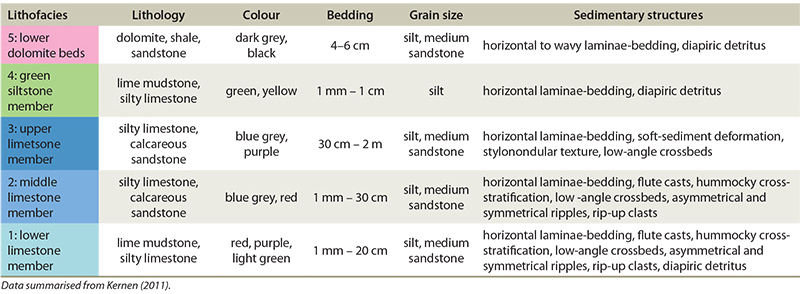
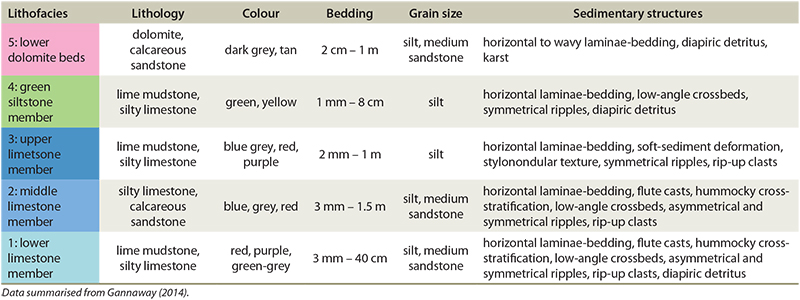
Detailed sedimentology and stratigraphic mapping were carried out adjacent to the Patawarta Diapir by Kernen et al. (2012; southern margin) and Gannaway et al. (2014; northern margin). Their respective work is summarised in Tables 1–2 with examples shown in Figures 4 and 5. The following units adjacent to Patawarta Diapir that directly pertain to this study are in ascending order: (1) lower limestone member of the Wonoka Formation (Nwwll); (2) middle limestone member of the Wonoka Formation (Nwwlm); (3) upper limestone member of the Wonoka Formation (Nwwlu); (4) green siltstone member of the Wonoka Formation; and (5) lower dolomite beds of the Patsy Hill Member within the Bonney Sandstone (Npbpdl).
Table 1 Summary of subsalt sedimentological characteristics, southern margin of Patawarta Diapir
Table 2 Summary of suprasalt sedimentological characteristics, northern margin of Patawarta Diapir
Based on the previous work of Haines (1988), Kernen et al. (2012) and Gannaway (2014), the stratigraphy surrounding Patawarta Diapir has been interpreted to be deposited in a shallowing upward wave-dominated shelfal setting (lower Wonoka – green siltstone members of the Wonoka Formation) to a tidally dominated tidal inlet setting (Patsy Hill Member).
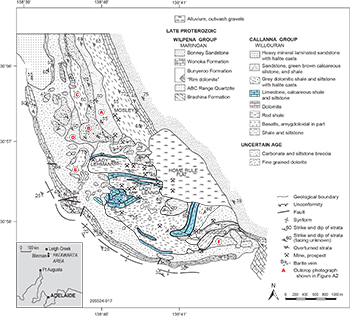
The Patawarta Diapir is roughly 4 km2 and is interpreted as an allochthonous salt body or a sheet-like salt body emplaced at stratigraphic levels above the autochthonous (layered evaporite sequence) source layer (Jackson and Talbot 1991; Rowan and Vendeville 2006; Kernen et al. 2012; Hearon et al. 2015; Rowan et al. 2020). Patawarta Diapir itself contains abundant inclusions of sedimentary units up to several kilometres wide (Appendix) that were roughly mapped by Hall (1984) and interpreted as being from the autochthonous Tonian Callanna Group layered evaporite sequence. The inclusions contain the following lithologies: (1) heavy mineral laminated sandstone and quartzite containing ripple cross-lamination and halite pseudomorphs; (2) thin interbeds of heavy mineral laminated sandstone and thinly bedded siltstone and shale; (3) green-brown calcareous siltstone and shale; (4) thinly bedded green-brown and grey calcareous and dolomitic shale and siltstone containing halite casts; (5) thinly bedded black limestone with finely bedded calcareous shale and siltstone; (6) weakly brecciated dolomite; (7) red shale; (8) amygdaloidal basalt; and (9) fine-grained dolerite (Appendix; Hall 1984).
The thinly bedded black-green limestone and calcareous siltstone and shale are not lithologies documented in the relatively age-equivalent autochthonous Callanna layered evaporite sequence in the Willouran and Gammon ranges. However, they are common inclusion lithologies in the southern part of the Patawarta Diapir and are the focal point for this study (Appendix).
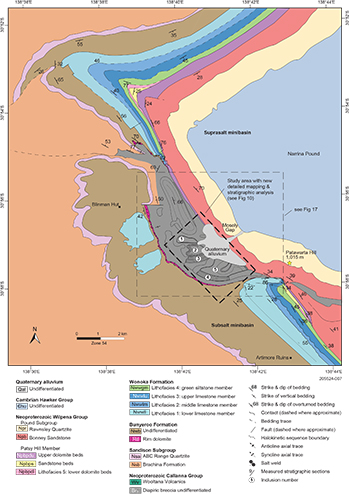
Kernen et al. (2012) interpreted the sedimentary strata along the southern margin of Patawarta Diapir as a subsalt minibasin (Fig 6; small basins, or depressions, that fill with sediment located below an allochthonous salt sheet; Jackson and Hudec 2017). Gannaway (2014) originally described and interpreted the sedimentary strata along the northern margin of Patawarta Diapir as a suprasalt minibasin (Fig 6; small basins, or depressions, that fill with sediment above an allochthonous salt sheet). The subsalt and suprasalt minibasins contain Wilpena Group strata of the upper Bunyeroo Formation, Wonoka Formation (lower, middle, upper members and green siltstone member), Patsy Hill Member (lower and upper dolomite beds, lower and upper sandstone beds) and lower Bonney Sandstone (Tables 1, 2; Figs 4, 5; Kernen et al. 2012; Gannaway 2014). All stratigraphic units thin and dip away from the diapir recording the halokinetic sequence history previously determined by Kernen (2011), Giles and Lawton (2002), Giles and Rowan (2012), Kernen et al. (2012) and Gannaway (2014). Based on the stratigraphic geometry of the subsalt minibasin, the upper Bunyeroo Formation, Wonoka Formation and Patsy Hill Member form one tapered halokinetic sequence in the subsalt minibasin adjacent to Patawarta Diapir (Fig 6; Kernen et al. 2012). Based on the stratigraphic geometry of the suprasalt minibasin, the upper Bunyeroo Formation, Wonoka Formation and Patsy Hill Member thin and onlap Patawarta Diapir while the uppermost portion of the Patsy Hill Member forms a thin carapace or roof over Patawarta Diapir (Fig 6; Kernen et al. 2012; Gannaway 2014).
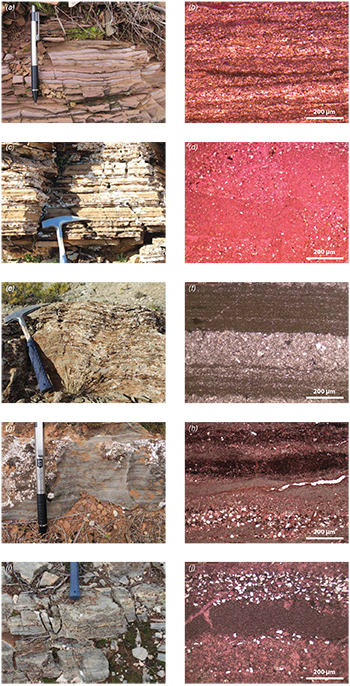
Figure 4 Examples of the subsalt lithofacies, southern margin of Patawarta Diapir. (a, b) Lithofacies 1, lower limestone member: outcrop and photomicrograph in polarised light. (Photos 418392, 418393); (c, d) Lithofacies 2, middle limestone member: outcrop and photomicrograph in polarised light. (Photos 418394, 418395); (e, f) Lithofacies 3, upper limestone member: outcrop and photomicrograph in polarised light. (Photos 418396, 418397); (g, h) Lithofacies 4, green siltstone member: outcrop and photomicrograph in plane light of sample collected from section R in Figure 7. (Photos 418398, 418399); (i, j) Lithofacies 5, lower dolomite beds: outcrop and photomicrograph in polarised light of sample collected from section U in Figure 7. (Photos 418400, 418401)
Figure 5 Examples of the suprasalt lithofacies, northern margin of Patawarta Diapir. (a, b) Lithofacies 1, lower limestone member: outcrop and photomicrograph in polarised light. (Photos 418402, 418403); (c, d) Lithofacies 2, middle limestone member: outcrop and photomicrograph in plane light. (Photos 418404, 418405); (e, f) Lithofacies 3, upper limestone member: outcrop and photomicrograph in plane light. (Photos 418406, 418407); (g, h) Lithofacies 4, green siltstone member: outcrop and photomicrograph in polarised light of sample collected from section B in Figure 7. (Photos 418408, 418409); (i, j) Lithofacies 5, lower dolomite beds: outcrop and photomicrograph in plane light of sample collected from section C in Figure 7. (Photos 418410, 418411)
Methods
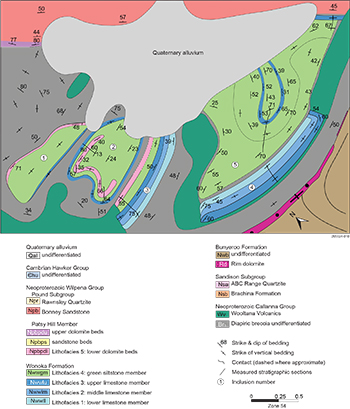
A 1:36,000 scale geological map of the limestone inclusions in the Patawarta Diapir was created and built on previous work (Figs 6, 7; Kernen et al. 2012; Gannaway 2014). Within the mapped area, 5 stratigraphic sections were measured in detail including lithology, grain size, fresh and weathered colours, bedding orientation and stratigraphic contacts. About 200 samples were collected to document the range of lithologies and varying mineralogies of the inclusions. One hundred petrographic thin sections were prepared and stained for calcite and iron with alizarin red-S and potassium ferricyanide and analysed in both plane- and cross-polarised light; matrix, cements and grain types and mineralogy were documented.
Fifty-eight limestone and dolostone samples were analysed for δ13C and δ18O values at the University of Michigan and University of Kansas stable isotope laboratories. Samples were slabbed perpendicular to bedding and 5 to 10 mg of powder were generated by micro-drilling the diapiric matrix, rim dolomite caprock, inclusion 3, and lower, middle, and upper Wonoka formations, and Patsy Hill Member from the suprasalt and subsalt minibasins. Because inclusion 3 contained all the representative carbonate inclusion lithologies, 2 samples were collected from lithofacies 1 and one sample from the other lithofacies (lithofacies 2–5). All powders were heated under vacuum in individual borosilicate reaction vials to 200 °C to remove volatile contaminants and water. Carbonate samples weighing a minimum of 10 mg were placed in stainless steel boats. Samples were then placed in individual borosilicate reaction vessels and reacted at 76 °C with 3 drops of H3PO4 on a Finnigan MAT Kiel I preparation device coupled directly to the inlet of a Finnigan MAT 251 triple collector isotope ratio mass spectrometer. δ13C and δ18O were acquired simultaneously on both systems, and isotopic data are reported in the standard delta notation (‰) relative to the VPDB standard (Vienna Pee Dee Belemnite). Precision and accuracy are monitored by running 14 standards for every 72 unknowns. The standard set included a primary standard (NBS-19) and a secondary, in-house marble standard. All samples were measured relative to an internal gas standard, and then converted to the VPDB scale using the known composition of NBS-19 (δ13C = 1.95‰; δ18O = −2.20‰). Measured precision was 0.05 to 0.1‰ for δ13C and 0.15 to 0.2‰ for δ18O.
Cathodoluminescence petrography was performed using a Relion ELM-3R Luminoscope in the University of Wisconsin-Oshkosh Geology Department. The voltage was held between 13 and 15 kV, with current ranging from 480 to 570 mA, and chamber vacuum between 50 and 60 millitorr. Photomicrographs in cathodoluminescence were used to recognise diagenetic alteration (paragenetic sequences) of the carbonate inclusions. Polarised-light microscopy was performed using polished, 30 μm thick, thin sections, analysed using a Nikon Eclipse E400 POL petrographic microscope to document carbonate mineralogy.
Figure 6 Geological map of Patawarta Diapir showing the location of the study area (modified from Gannaway 2014; Kernen et al. 2012).
Results
Intrasalt inclusion sedimentology
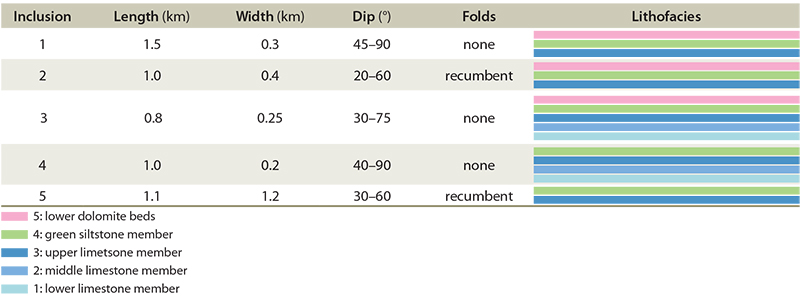
Five sedimentary inclusions containing primarily silty limestone, calcareous siltstone and shale were identified within the southwestern part of Patawarta Diapir (Figs 8, 9; Tables 3, 4):
- Inclusion 1 is located the farthest north in the Patawarta Diapir and is 1.5 by 0.3 km. It displays steep dips (up to 90°) that gradually decrease northward to approximately 45° (Fig 10; Tables 4–5).
- Inclusion 2 is located south of inclusion 1. It is 1.0 by 0.4 km and displays a recumbent fold with steep dips (50–60°) to the west and shallow dips to the east (20–30°; Fig 10; Tables 4–5).
- Inclusion 3 is located directly south of inclusion 2. It is 0.8 by 0.25 km and displays steeper dips (50–75°) to the west and shallower dips to the east (30–50°).
- Inclusion 4 is located south of inclusion 3 and southwest of inclusion 5. It is 1.0 by 0.20 km and displays relatively consistent northwest–southeast-trending 40–50° dips on the northwestern side that steepen to 90° and are tightly folded on the southeastern side.
- Inclusion 5 is directly northeast of inclusion 4 and is the largest inclusion. It is 1.1 by 1.2 km and displays varying dips (30–60°) that form a large recumbent fold (Fig 10; Tables 4–5).
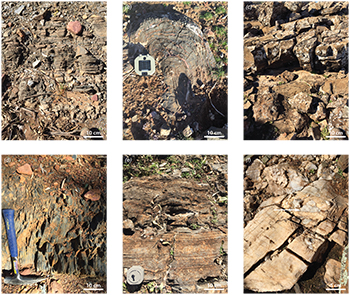
Figure 8 Outcrop exposures of lithofacies from inclusion 3 (stratigraphic section 3), Patawarta Diapir. Each image corresponds to the lithofacies in Figs. 10–11 and Tables 3–6. (a) Lime mudstone, lithofacies 1. (Photo 418412); (b) Silty limestone, lithofacies 2. (Photo 418413); (c) Silty limestone, lithofacies 3. (Photo 418414); (d) Siltstone, lithofacies 4. (Photo 418415); (e) Sandy dolomite, lithofacies 5. (Photo 418416); (f) Calcite veins crosscutting lithofacies 4 (arrow marks secondary quartz vein). (Photo 418417)
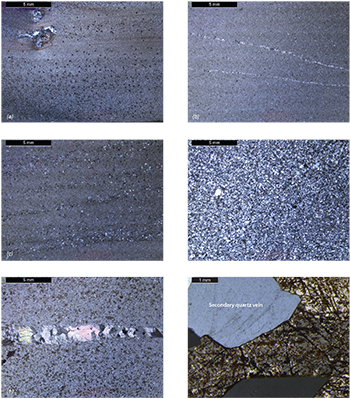
Figure 9 Photomicrographs (cross-polarised light) of lithofacies from inclusion 3 (stratigraphic section 3), Patawarta Diapir. Each image corresponds to the lithofacies in Figs. 10–11 and Tables 3–6. (a) Lime mudstone, lithofacies 1. (Photo 418418); (b) Silty limestone, lithofacies 2. (Photo 418419); (c) Silty limestone, lithofacies 3. (Photo 418420); (d) Siltstone, lithofacies 4. (Photo 418421); (e) Silty dolomite, lithofacies 5. (Photo 418422); (f) Calcite veins crosscutting lithofacies 4. (Photo 418423)
Table 3 Size, structural characteristics and lithofacies succession of sedimentary inclusions in the Patawarta Diapir
Table 4 Summary of intrasalt inclusion sedimentology inside the Patawarta Diapir
The inclusions are bounded by diapiric matrix or mafic igneous sills (Figs 10, 11). The northern, western and southern margins of all 5 inclusions are in contact with the diapiric matrix and the eastern portion is covered by recent alluvium (Fig 10).
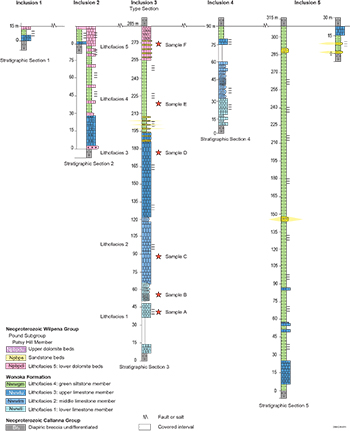
The inclusions are characterised by internally coherent bedding trends that define an internal stratigraphy. That internal stratigraphy is marked by 5 distinct lithofacies (1–5), which were mapped in detail (Figs 8–10). The inclusion lithofacies are described below in ascending stratigraphic order (Tables 3, 4).
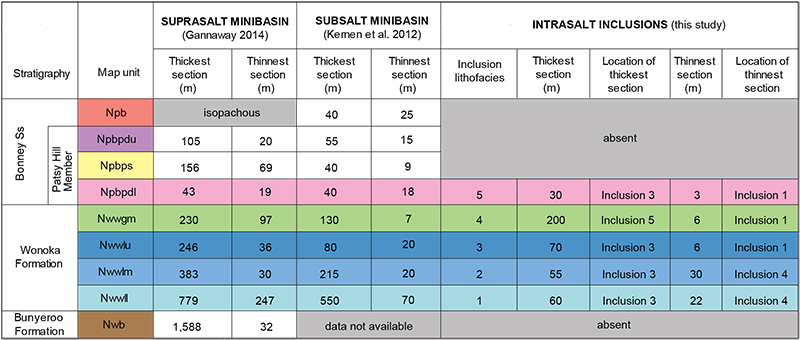
Lithofacies 1 is 22–60 m thick and is composed of grey to tan, thinly laminated (1–3 mm) calcareous siltstone and silty lime mudstone that form beds 1–5 cm thick (Figs 8a, 9a, 10). It is dominated by calcareous siltstone at the base with decreasing quartz silt stratigraphically up-section where the beds become carbonate rich. Lithofacies 1 is always in contact with the diapiric matrix at the lower boundary and is only found in inclusions 3 and 4; the upper boundary is in contact with lithofacies 2 in both inclusions (Fig 11; Tables 3, 4).
Lithofacies 2 is 30–55 m thick and composed of tan and grey, thinly laminated (1–5 mm) silty lime mudstone interbedded with lime mudstone that forms beds 5–10 cm thick (Figs 8b, 9b, 10). It is dominated by silty lime mudstone at the base and decreasing quartz silt content up-section where the beds become lime mudstone. Lithofacies 2 is only found in inclusions 3 and 4 where it overlies lithofacies 1 and underlies lithofacies 3 (Fig 11; Tables 3, 4).
Lithofacies 3 is 6–70 m thick and composed of tan, thinly laminated (5–10 mm) silty lime mudstone interbedded with lime mudstone that forms beds 10–30 cm thick (Figs 8c, 9c, 10). It is dominated by silty lime mudstone at the base and decreases in quartz silt content up-section. Lithofacies 3 is found in inclusions 1–5 where it consistently lies stratigraphically below lithofacies 4. Lithofacies 3 overlies lithofacies 2 in inclusions 3 and 4 (Fig 11; Tables 3, 4).
Lithofacies 4 is 6–200 m thick and is composed of dark greenish black to light green, thinly laminated (3–5 mm) calcareous siltstone to shale that form beds 1–5 cm thick (Figs 8d, 9d, 10). It is dominated by calcareous siltstone at the base with apparent thin bedding while the upper portion is dominated by a massive green siltstone that is non-calcareous. Lithofacies 4 is found in inclusions 1–5 and overlies lithofacies 3 (Fig 11; Tables 3, 4).
Lithofacies 5 is 3–30 m thick and is composed of tan, thinly laminated (1–3 mm) sandy dolomite (calcite cement) that forms laminae 5–10 mm thick with local symmetrical wave-rippled horizons and rare massive bedding (Figs 8e, 9e, 10). Lithofacies 5 is found in inclusions 1–3 and stratigraphically above lithofacies 4 (Fig 11; Tables 3, 4).
Figure 10 Detailed geological map of limestone inclusions (1–5) in the Patawarta Diapir. Map area is located in Figure 6. Attributes of lithofacies types within sedimentary inclusions are summarised in Table 4.
Based on outcrop and petrographic sedimentological attributes and stratigraphic order, lithofacies 1–5 lithostratigraphically correlate to the Wonoka Formation and Patsy Hill Member stratigraphic map units in the suprasalt and subsalt minibasins adjacent to Patawarta Diapir. In ascending order: lithofacies 1 is equivalent to the lower limestone member of the Wonoka Formation; lithofacies 2 is equivalent to the middle limestone member of the Wonoka Formation; lithofacies 3 is equivalent to the upper limestone member of the Wonoka Formation; lithofacies 4 is equivalent to the green siltstone member of the Wonoka Formation; and lithofacies 5 is equivalent to the lower dolomite beds of the Patsy Hill Member (Table 5).
Table 5 Stratigraphic unit thickness variations of the suprasalt and subsalt minibasins compared to thickness trends of the intrasalt inclusions in the Patawarta Diapir
Because the stratigraphy lacks wave and current sedimentary structures, ‘stratigraphic up’ was determined by the specific stratigraphic order of lithologies. The order of lithofacies 1–5 matches the order of the lower green siltstone member of the Wonoka Formation and lower dolomite beds of the Patsy Hill Member. Based on this correlation, the silty carbonate inclusions are identified as Ediacaran Wonoka Formation and Patsy Hill Member and not units of the Callanna Group as previously interpreted by Coats (1973) and Hall (1984).
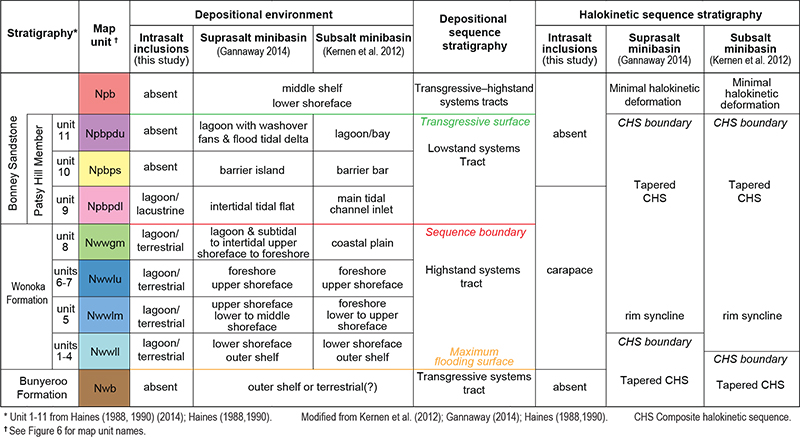
The subsalt and suprasalt Wonoka Formation adjacent to Patawarta Diapir contains the lower limestone member which displays horizontal laminae and reduction spots in the lime mudstone beds and hummocky cross-stratification in the silty lime mudstone beds (Kernen et al. 2012; Gannaway 2014; Table 6). These observations correlate to units 4–9 from Haines (1988,1990). The interpretation of these sedimentary structures suggests an outer shelf depositional environment below storm wave-base (Preiss 1987; Haines 1988, 1990 unit 4; Walker and Plint 1992; Kernen et al. 2012; Gannaway 2014; Table 6).
Table 6 Compilation of the stratigraphic units surrounding Patawarta Diapir and their depositional environments, and depositional and halokinetic sequence stratigraphy for intrasalt, suprasalt and subsalt
The middle limestone member of the Wonoka Formation displays hummocky cross-stratification in the calcareous siltstone beds overlain by calcareous siltstone beds and low-angle cross-bedding, and asymmetrical and symmetrical ripples in the quartz arenite sandstones beds (Haines 1988, 1990 Unit 5; Walker and Plint 1992; Kernen et al. 2012; Gannaway 2014; Table 6). The interpretation of these sedimentary structures suggests a lower to upper shoreface depositional environment with the sandstone beds deposited in the foreshore depositional environment (Haines 1988, 1990; Walker and Plint 1992; Kernen et al. 2012; Gannaway 2014; Table 6).
The upper limestone member of the Wonoka Formation is interpreted to be deposited in the foreshore depositional environment (Haines 1988, 1990, units 5–6; Walker and Plint 1992; Kernen et al. 2012; Gannaway 2014; Table 6).
The green siltstone member of the Wonoka Formation lacks current and wave sedimentary structures and is interpreted to be deposited in a coastal plain depositional environment (Haines 1988, 1990, unit 8; Kernen et al. 2012; Gannaway 2014; Table 6).
The Patsy Hill lower dolomite beds are interpreted to be deposited in a tidally dominated main tidal channel inlet depositional environment (Colquhoun 1995; Kernen et al. 2012; Gannaway 2014; Table 6) based on the rhythmically interbedded dark grey dolomite and pyrite-rich black shale, quartzite pebble conglomerate and sand stringers that scour into the underlying microbial laminate (Haines 1988, 1990, unit 9).
The sedimentary structures of the lower, middle, upper and green siltstone members of the Wonoka Formation inclusions are limited (horizontal laminae almost exclusively) and therefore each member or bed is interpreted to be deposited in a terrestrial to lagoonal depositional environment. The lower dolomite beds of the Patsy Hill Member display wavy bedding which likely indicates microbial laminae; therefore, it is most likely that lithofacies 5 was deposited in shallow water – lagoonal depositional environment which is nearly identical to the subsalt and suprasalt minibasins.
The lithologic order of lithofacies 1–5 matches the lithologic order of the lower, middle, upper and green siltstone members of the Wonoka Formation and lower dolomite beds of the Patsy Hill Member in the subsalt and suprasalt minibasins. All members of the Wonoka Formation and lower dolomite beds of the Patsy Hill Member contain intraformational conglomerates (coarse sand- to pebble-sized) that are related to the uplift and halokinesis of the Patawarta Diapir during the depositional history and formation of the suprasalt and subsalt minibasins. However, the inclusion stratigraphy lacks the intraformational conglomerates which indicates that halokinesis did not take place and it most likely formed as a roof or carapace (Hart et al. 2004).
Stable isotope results and diagenesis
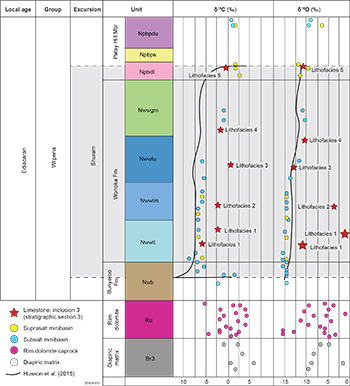
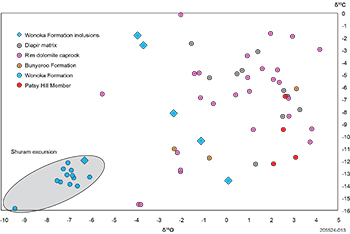
δ13C and δ18O isotopes from limestone and dolomite inclusions, caprock, diapir matrix, and sub-and suprasalt minibasins were analysed and plotted stratigraphically and compared to previous regional data and the adjacent minibasin stratigraphy (Figs 12, 13). The δ13C and δ18O isotope values were measured from lithofacies 1–5 within inclusion 3 at stratigraphic section 3 (Figs 10–13). Six samples were collected in total: 2 samples from lithofacies 1 and one sample each from lithofacies 2–5 (Figs 10–13). δ13C and δ18O isotopes of the 6 samples from inclusion 3 were plotted (grey oval; Fig 13). The δ13C and δ18O isotope values from inclusion 3 plots within the range of values for the Shuram excursion in the adjacent minibasin succession; however, the other 5 values are more positive than expected (Figs 12–14).
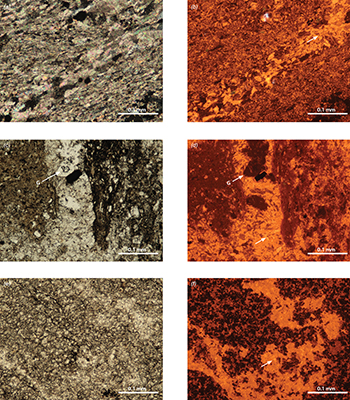
To understand the isotopic variation of the inclusions, thin sections were examined under cathodoluminescence (Fig 15). The geochemical data from inclusion stratigraphic section 3 (type section) of the Wonoka Formation and Patsy Hill Member are presented in a stratigraphic framework to compare to the inclusion lithofacies and to assess the effects of diagenesis. Lithofacies 1 is comprised of a lime mudstone with fine-grained crystalline matrix that luminesces brown-orange with calcite-rich veins that luminesce orange-yellow and crosscut lithofacies 1 (Figs 15a, b). Lithofacies 3 is comprised of a silty limestone matrix that luminesces orange-dark orange and is crosscut by orange-yellow luminescing calcite veins and quartz cement replacing gypsum (Figs 15c, d). Lithofacies 5 is dominated by a silty dolomite matrix that is dark brown/black under cathodoluminescence which is crosscut by calcite veins that luminesce orange-yellow (Figs 15e, f).
Figure 12 δ13C and δ18O isotopes used as a chemostratigraphic tool to identify Wonoka Formation and Patsy Hill Member stratigraphy in the Patawarta Diapir. The location and stratigraphic level of the samples is shown in Figures 10 and 11.
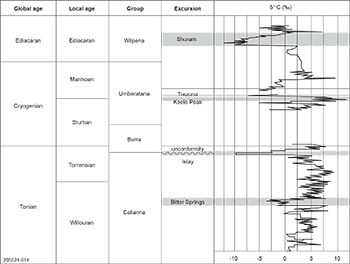
Figure 14 Global δ13C isotope curve for Neoproterozoic (modified from Condon et al. 2005). Possible negative carbon isotope excursions in the Flinders Ranges inclusions could be from the Bitter Springs, Trezona or Shuram excursions. The Islay excursion is not found in the Flinders Ranges.
Figure 15 Photomicrographs of lithofacies from inclusion 3 (stratigraphic section 3), Patawarta Diapir. Each image corresponds to the lithofacies in Figures 8–11; Tables 3–6. (a) Lime mudstone, lithofacies 1, in cross-polarised light. (Photo 418424); (b) Lime mudstone, lithofacies 1, under cathodoluminescence. Lime mudstone (brown/orange fine-grained crystalline matrix) with crosscutting calcite-rich (orange-yellow) veins (arrow marks diagenetic alteration). (Photo 418425); (c) Silty limestone, lithofacies 3, in cross-polarised light. (Photo 418426); (d) Silty limestone, lithofacies 3, under cathodoluminescence. Silty limestone (orange/dark orange matrix) with crosscutting calcite-rich (orange-yellow) veins (arrow marks diagenetic alteration) and quartz replacing gypsum (G). (Photo 418427); (e) Silty dolomite, lithofacies 5, in cross-polarised light. (Photo 418428); (f) Silty dolomite, lithofacies 5, under cathodoluminescence. Silty dolomite (dark brown/black) matrix with crosscutting calcite-rich (orange-yellow) veins (marked by arrow). (Photo 418429)
Discussion
Evolution of the diapir
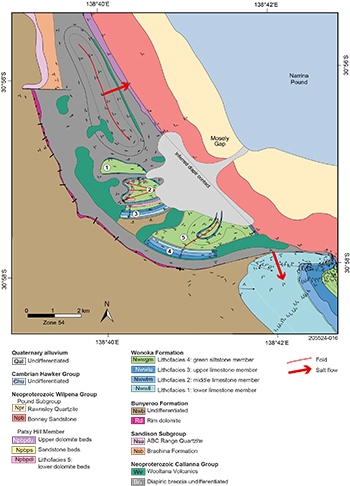
The inclusions in map view currently appear as individual ‘xenoliths’ in the diapir surrounded by diapiric matrix which may indicate that it was once a large panel of stratigraphy that was subsequently faulted and folded by post-halokinesis movement and encasement. Once a carapace is encased and incorporated into a diapir, it is defined as a suture (Dooley et al. 2012). Dooley et al. (2012) describes 2 types of sutures, one type referred to as an autosuture which is a panel of stratigraphy that separates 2 lobes from a single salt sheet and the other type referred to as an allosuture which is a panel of stratigraphy that separates 2 coalesced salt sheets. There are 2 types of allosutures, one being a frontal allosuture whereby its map trace is roughly perpendicular to the main direction of salt flow and a lateral allosuture whereby its map trace is roughly parallel to the main direction of salt flow (Dooley et al. 2012). We are not able to distinguish between a lateral or frontal allosuture in this study because of the 2D nature of outcrop studies.
The Ediacaran inclusions in Patawarta Diapir are forming an allosuture based on a combination of the following observations:
- The distribution of Tonian Curdimurka Subgroup layered evaporite sequence inclusions is concentrated on the northern side of the diaper, while the significantly younger Ediacaran Wonoka Formation and Patsy Hill Member inclusions are concentrated on the southern side of the diapir (Figs 16, 17). An equal distribution of inclusions throughout Patawarta Diapir would suggest all the inclusions are relatively the same age.
- The detailed stratigraphic changes from the suprasalt minibasin (Giles et al. 2017) and subsalt minibasin (Lehrmann et al. 2017) suggest the suprasalt minibasin was not depositionally connected to the subsalt minibasin. Because the detailed stratigraphy of the Wonoka Formation and lower dolomite beds of the Patsy Hill Member from the suprasalt and subsalt minibasins are slightly different in terms of water depth and thickness compared to the stratigraphy of the inclusions, the carapace is interpreted to represent either a lateral or frontal allosuture (Tables 5, 6). The sedimentary structures within the suprasalt and subsalt minibasins capture the overall shallowing upward sequence of the third order highstand systems tract that is not seen in the inclusion stratigraphy (Tables 5, 6; Kernen et al. 2012). If the detailed stratigraphy of the Wonoka Formation and Patsy Hill Member were identical in the suprasalt and subsalt minibasins and inclusions, an autosuture (Dooley et al. 2012) would be a more likely interpretation.
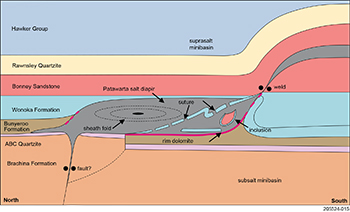
- One salt sheet is thought to be sourced from the northwest, with internal flow represented by the Tonian Curdimurka Subgroup layered evaporite sequence sheath fold (Fig 17; Rowan et al. 2020), and the other sheet was likely sourced from the southeast based on the orientation of the halokinetic fold in the subsalt Bunyeroo Formation established by Hearon et al. (2015; Fig 17). If the sheath fold and halokinetic fold were orientated in the same direction, an autosuture interpretation would be more plausible.
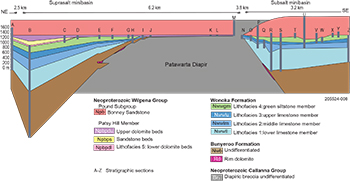
The frontal or lateral allosuture at Patawarta Diapir could have been encased by the following salt tectonic processes: (1) one salt sheet overriding another salt sheet; (2) one salt sheet overriding a flared diapir; or (3) the amalgamation of 2 or more diapirs or salt sheets. It is conceivable that the encasement of the carapace was initiated by a combination of the following processes: (1) the Delamerian Orogeny (Preiss 2000); (2) low-angle gravity sliding that takes place on the shelf; and (3) high sedimentation rates in the suprasalt minibasin. Based on the regional map geometry of the connecting salt bodies (diapiric breccias), it is likely that a salt body was sourced from the northern side of Patawarta Diapir and the thickened Wonoka Formation suprasalt depocentre provided the sedimentary loading mechanism for a salt body on the northern side of the diapir to override a salt body on the southern side of the diapir, thus encasing the carapace in the diapiric matrix and forming an allosuture (Figs 16, 17). With the interpretation of an allosuture, Patawarta Diapir is reinterpreted to represent at least 2 diapirs instead of a single diapir as originally mapped by Coats (1973) and Hall (1984; Fig 17).
Figure 16 Schematic cross-section of the Wonoka Formation and Patsy Hill Member inclusions inside the Patawarta Diapir (modified from Hearon et al. 2015). The layered evaporite sequence sheath fold is located in a northern updip salt body separated by a suture (allosuture) and a second southern salt body.
Figure 17 Geological map of the Patawarta Diapir (modified from Kernen et al. 2019; Rowan et al. 2020). Red lines in inclusions 2 and 5 are refolded folds, red line to the north is the axial trace of a sheath fold with the red arrow indicating the direction of salt flow (Rowan et al. 2020). The red arrow to the south (Hearon et al. 2015) indicates the direction of salt flow (using the outboard halokinetic sequence fold plane to calculate direction). Map area is located in Figure 6.
Chemostratigraphy and diagenesis
Abrupt changes in the δ13C ratios are known as carbon isotope excursion events that are used as a correlation tool to a known basin-wide event. Those excursion events are typically given a name and are compared to excursions and sequence stratigraphy in other sedimentary basins.
The oldest documented Neoproterozoic carbon isotope excursion in the Tonian (Willouran and Torrensian) is called the Bitter Springs excursion which is in the Amadeus Basin Bitter Springs Formation (carbonate) near Alice Springs (Fig 14; Klaebe 2015). The Bitter Springs excursion is approximately δ13C −3‰ to −4‰ PDB (Pee Dee Belemnite) and the stratigraphic equivalent formation in the Willouran of the Flinders Ranges is not clear as a proper correlation is yet to be discovered and described (Stüeken et al. 2019).
The second oldest carbon isotope excursion is called the Islay excursion which contains the most negative carbon isotopic signature at δ13C −9‰, however, there is an unconformity during this time in the Willouran and Flinders Ranges and strata of that age are not found (Fig 14; Condon et al. 2005).
The Keele Peak excursion in the Marinoan Umberatana Group is the only positive carbon isotope excursion at δ13C +12‰ (Fig 14; Condon et al. 2005). The Trezona excursion in the Marinoan Umberatana Group becomes the negative at δ13C −7‰ and is documented in the Flinders Ranges stratigraphy (Fig 14; Condon et al. 2005).
The youngest Marinoan excursion is referred to as the Ediacaran Shuram excursion (Fike et al. 2006; Grotzinger et al. 2011; Husson et al. 2015; Le Guerroué et al. 2010), which has δ13C values as low as −12‰, thus constituting the most negative δ13C excursion known in Earth’s history (Fig 14; Husson et al. 2015). In this study, the Shuram excursion is documented in the Wonoka Formation adjacent to Patawarta Diapir, however, the inclusions of Wonoka Formation stratigraphy inside the Patawarta Diapir have been diagenetically altered, therefore altering the Shuram excursion isotope signature.
Previous studies on the Shuram excursion in the Flinders Ranges provide a variety of explanations for its origin such as:
- Primary dissolved inorganic carbon. Carbon isotope compositions of unaltered carbonates (δ13C carb) precipitated in equilibrium with seawater. This reflects the composition of dissolved inorganic carbon reservoir in the oceans, as precipitation of carbonates involves little isotopic fractionation relative to the dissolved inorganic carbon pool (Hayes and Waldbauer 2006; Halverson et al. 2010; Schmid 2017). Carbon isotopes constrain primary productivity and organic matter burial where the organisms prefer to uptake light carbon isotopes 12C against 13C during chemical reactions. Therefore, organic material will be enriched in light carbon isotope compared to the original pool of carbon.
- Meteoric diagenesis. Based on recrystallisation in the presence of CO2 rich fluids derived from organic matter in soils (Knauth and Kennedy 2009; Swart and Kennedy 2012). Sourced from δ18O depleted rainwater, these fluids can create covarying δ13C carb and δ18O carb ranges as they mix with marine waters heavier in both δ13C carb and δ18O carb (Allan and Matthews 1982).
- Burial diagenesis. Where an extreme depletion in δ13C carb was acquired significantly after burial of the Ediacaran sediments (i.e., under 2–3 km of overburden, at 100 °C; Derry 2010). Shuram-like excursion profiles result from alteration by a mixture between a high pCO2, low δ13C carb fluid, developed from respired buried organic matter, and an δ18O rich basinal brine (Derry 2010).
- Authigenic carbonate. Development of authigenic carbonate in very δ13C depleted carbonate environment during early sediment diagenesis (Schrag et al. 2013).
When comparing the δ13C results to the regional Wonoka Formation and Patsy Hill Member data from Husson et al. (2015), lithofacies 1–3 have higher values, lithofacies 4 has a similar value and lithofacies 5 has slightly lower values (Figs 12, 13). The δ13C values of the diapiric matrix and rim dolomite are higher relative to those of the regional Wonoka Formation (Husson et al. 2015) and to the results from the Wonoka Formation in this study (Figs 13, 14). An interpretation of the isotopically positive results from the diapiric matrix and rim dolomite are yet to be published and require further detailed analysis and interpretation. The δ18O values from the lower Wonoka limestone member are like the published regional δ18O values (Husson et al. 2015), however, there is no obvious correlation with the other members of the carbonate inclusion stratigraphy.
The results of the δ13C geochemistry, along with the outcrop and petrographic observations with cathodoluminescence microscopy, suggest that the inclusions are diagenetically altered limestones of the Wonoka Formation and Patsy Hill Member. The δ13C results from the inclusions are not as negative as reported by Husson et al.’s (2015) regional study of −12‰. The −12‰ value is not captured in our results because: (1) the lowermost part of lithofacies 1 could be missing due to an erosional unconformity or it was never deposited; or (2) the δ13C results are diagenetically altered from fluid flow within Patawarta Diapir (Fig 15). The positive δ13C values of the diapiric matrix and rim dolomite also indicates that a post-encasement fluid flow event took place, partially replacing the original δ13C values which resulted in a positive δ13C signature. The δ18O isotope results are not consistent with Husson et al. (2015) which supports the hypothesis that post-encasement fluid flow took place (Figs 13–15). Cathodoluminescence microscopy of lithofacies 3 and 5 indicate a calcite-rich diagenetic event took place after the encasement of the inclusions, thus being the source of the diagenetic alteration of rocks deposited during the Shuram excursion (Fig 15).
Conclusion
Patawarta Diapir contains inclusions that are c. 300 million years younger than previously thought. The Wonoka Formation and Patsy Hill Member inclusions suggest active halokinesis during the Ediacaran era. The sedimentology and stratigraphic relationships of inclusions 1–5 in the Patawarta Diapir are described in detail and correlated to the Wonoka Formation and Patsy Hill Member in the adjacent suprasalt and subsalt minibasins. The presence of isopachous inclusion stratigraphy allow for the inclusions to be interpreted as a carapace, a condensed section deposited above a diapiric body. Additionally, the Wonoka Formation and Patsy Hill Member inclusions are stratigraphically thinner than the equivalent strata in the subsalt or suprasalt minibasins which supports the carapace interpretation. Because the disrupted remnants of carapace are now surrounded by diapiric matrix in Patawarta Diapir, it is interpreted that the carapace was encased by one salt diapir overriding another forming an allosuture. The mechanisms for encasement are poorly constrained, however, they could be possible through regional shortening of the Delamerian Orogeny, high sedimentation rates in the suprasalt minibasin, and low-angle gliding along the regional shelf. The Callanna Group sheath fold indicates the diapir was flowing to the northeast and is separated by the disrupted allosuture, while the halokinetic fold in the subsalt Bunyeroo Formation indicates the southern portion of the diapir was flowing toward the south. The difference in salt flow direction supports the interpretation that the Wonoka Formation and Patsy Hill Member inclusions form an allosuture. The results of the δ13C and δ18O stable isotope geochemistry suggest that the Wonoka Formation and Patsy Hill Member inclusions contain a diagenetically altered Shuram excursion within the Patawarta Diapir. The stable isotope geochemical data are supplemented by cathodoluminescence microscopy and indicate calcite-rich diagenetic fluid flow events took place post-encasement of the Wonoka Formation and Patsy Hill Member inclusions and thus altered their δ13C and δ18O signatures. These data conclude that multiple fluid flow events take place in diapirs and are concentrated to inclusions or zones of heterogenous lithologies.
Appendix
Figure A1 Geological map of the Patawarta Diapir showing variable lithologies of inclusions in the diapiric breccia. The anomalous limestone and calcareous siltstone and shale inclusions are highlighted in blue (modified from Hall 1984). Those inclusions were originally classified as Tonian Callanna Group stratigraphy. The results of this study identify the blue inclusions as Ediacaran Wonoka Formation stratigraphy.
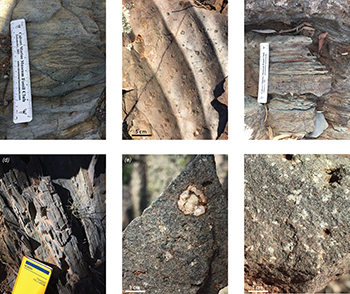
Figure A2 Outcrop photographs of Tonian Callanna Group inclusions. Samples are located in Figure A1. (a) Heavy mineral laminated sandstone. (Photo 418430); (b) Ripple marks and halite pseudomorphs in quartzite. (Photo 418431); (c) Fine interbeds of laminated heavy mineral bearing sandstone and thinly bedded green brown calcareous siltstone and shale. (Photo 418432); (d) Thinly bedded green black calcareous shale and siltstone. (Photo 418433); (e) Amygdaloidal basalt. (Photo 418434); (f) Dolerite. (Photo 418435)
Acknowledgements
The field research and geochemical analyses were funded by present and past corporate sponsors of the Salt–Sediment Interaction Research Consortium, first at New Mexico State University (as the Institute of Tectonic Studies) and later at the University of Texas at El Paso (Anadarko, BHP, BP, Chevron, ConocoPhillips, Devon, ExxonMobil, Hess, Kosmos, Marathon, Nexen, Repsol, Samson, Shell, Statoil (Equinor), Total), the American Association of Petroleum Geologists Grants-In-Aid, the Society of Professional Earth Scientists Award, the University of Texas El Paso Geological Sciences Bruce Davidson Memorial Award, the West Texas Geological Society Award, the Roswell Geological Society Award, the University of Texas El Paso Geological Sciences Hunt and Rowling Scholarship and the Vernon G. and Joy Hunt Endowed Scholarship.
Carmen Krapf (Geological Survey of South Australia) and Peter Haines (Geological Survey of Western Australia) are thanked for their thorough reviews of this paper.
References
Allan JR and Matthews RK 1982. Isotope signatures associated with early meteoric diagenesis. Sedimentology 29(6):797–817. doi:10.1111/j.1365-3091.1982.tb00085.
Clark JA, Cartwright JA and Stewart SA 1999. Mesozoic dissolution tectonics on the West Central shelf, UK Central North Sea. Marine and Petroleum Geology 16(3):283–300. doi:10.1016/S0264-8172(98)00040-3.
Cloud PE and Glaessner MF 1982. The Ediacarian period and system: Metazoa inherit the Earth. New York Science Journal 217:783–792.
Colquhoun GP 1995. Siliciclastic sedimentation on a storm- and tide-influenced shelf and shoreline, Early Devonian Roxburgh Formation, northeastern Lachlan Fold Belt, southeastern Australia. Sedimentary Geology 97:63–93. doi:10.1016/0037-0738(94)00142-H.
Condon D, Zhu M, Bowring S, Wang W, Yang A and Jin A 2005. U–Pb ages from the Neoproterozoic Doushantuo Formation, China. Science 308(5718):95–98. doi:10.1126/science.1107765.
Dalgarno CR and Johnson JE 1968. Diapiric structures and late Precambrian–Early Cambrian sedimentation in Flinders Ranges, South Australia. In Braunstein J and O’Brien GD eds, Diapirs and diapirism, AAPG Memoir 8. American Association of Petroleum Geologists, pp 301–314. doi:10.1306/M8361.
Derry LA 2010. A burial diagenesis origin for the Ediacaran Shuram-Wonoka carbon isotope anomaly. Earth and Planetary Science Letters 294(1–2):152–162. doi:10.1016/j.epsl.2010.03.022.
Diegel FA, Karlo JF, Schuster DC, Shoup RC and Tauvers PR 1995. Cenozoic structural evolution and tectonostratigraphic framework of the northern Gulf Coast continental margin. In Jackson MPA, Roberts DG and Snelson S eds, Salt tectonics: a global perspective, AAPG Memoir 65. American Association of Petroleum Geologists, pp 109–151. doi:10.1306/M65604.
Dooley TP, Hudec MR and Jackson MPA 2012. The structure and evolution of sutures in allochthonous salt. AAPG Bulletin 96(6):1045–1070. doi:10.1306/09231111036.
Dunn PR, Plumb KA and Roberts HG 1966. A proposal for time-stratigraphic subdivision of the Australian Precambrian. Journal of the Geological Society of Australia 13:593–608. doi:10.1080/00167616608728634.
Dyson IA 1996. Stratigraphy of the Neoproterozoic Aruhna and Depot Springs subgroups, Adelaide Geosyncline. Transactions of the Royal Society of South Australia 120(3):101–115.
Dyson IA 2005. Evolution of allochthonous salt systems during development of a divergent margin: the Adelaide Geosyncline of South Australia. 25th Annual GCSSEPM Foundation Bob F. Perkins Research Conference 2005: Petroleum Systems of Divergent Continental Margin Basins. Gulf Coast Section, SEPM, Houston, pp 69–89.
Fike DA, Grotzinger JP, Pratt LM and Summons RE 2006. Oxidation of the Ediacaran ocean. Nature 444:744–747. doi:10.1038/nature05345.
Giles KA and Lawton TF 2002. Halokinetic sequence stratigraphy adjacent to the El Papalote diapir, northeastern Mexico. AAPG Bulletin 86:823–840. doi:10.1306/61EEDBAC-173E-11D7-8645000102C1865D.
Giles KA and Rowan MG 2012. Concepts in halokinetic–sequence deformation and stratigraphy. In Alsop GI, Archer SG, Hartley AJ, Grant NT and Hodgkinson R eds, Salt tectonics, sediments and prospectivity, Geological Society, London, Special Publications 363:7–31. doi:10.1144/SP363.2.
Giles S, Kernen RA, Lehrmann A and Giles K 2017. Evolution of a suprasalt minibasin: Neoproterozoic (Ediacaran) Patawarta salt sheet, Flinders Ranges, South Australia. Geological Society of America South Central Annual Conventions Abstracts Volumes, San Antonio.
Glaessner MF 1961. Pre-Cambrian animals. Scientific American March 1961:2–8.
Grotzinger JP, Fike DA and Fischer WW 2011. Enigmatic origin of the largest-known carbon isotope excursion in Earth's history. Nature Geoscience 4:285–292. doi:10.1038/ngeo1138.
Haines PW 1988. Storm-dominated mixed carbonate/siliciclastic shelf sequence stratigraphy displaying cycles of hummocky cross-stratification, late Proterozoic Wonoka Formation, South Australia. Sedimentary Geology 58(2–4):237–254. doi:10.1016/0037-0738(88)90071-1.
Haines PW 1990. A late Proterozoic storm-dominated carbonate shelf sequence: the Wonoka Formation in the central and southern Flinders Ranges, South Australia. In Jago JB and Moore PS eds, The evolution of a late Precambrian–early Paleozoic rift complex: Adelaide Geosyncline, Special Publication 16. Geological Society of Australia, Sydney, pp 117–198.
Hall D 1984. The mineralisation and geology of Patawarta Diapir, northern Flinders Ranges, South Australia. BSc Hons thesis, University of Adelaide.
Halverson GP, Wade BP, Hurtgen MT and Barovich KM 2010. Neoproterozoic chemostratigraphy. Precambrian Research 182(4):337–350. doi:10.1016/j.precamres.2010.04.007.
Hart W, Jaminski J and Albertin M 2004. Recognition and exploration significance of suprasalt stratal carapaces. In Post PJ, Olson DL, Lyons KT, Palmes SL, Harrison PF and Rosen NC, Salt-sediment interactions and hydrocarbon prospectivity: concepts, applications, and case studies for the 21st century. Society for Sedimentary Geology, pp 166–199. doi:10.5724/gcs.04.24.0166.
Hayes J and Waldbauer J 2006. The carbon cycle and associated redox processes through time. Philosophical Transactions of the Royal Society of London, Series B, Biological Sciences 361(1470):931–950. doi:10.1098/rstb.2006.1840.
Hearon TE IV, Rowan MG, Giles KA, Kernen RA, Gannaway CE, Lawton TF and Fiduk CJ 2015. Allochthonous salt initiation and advance in the northern Flinders and eastern Willouran ranges, South Australia: using outcrops to test subsurface-based models from the northern Gulf of Mexico. AAPG Bulletin 99(2):293–331. doi:10.1306/08111414022.
Helgesen HK, Tang J, Liu J, Salama A, Pepper R, Madden S, Woodward M, Klebleeva A, Frugier-Dorrington E, El Sabaa A, Yarman CE, Fournier A, Yang Y and Osypov KS 2013. Dirty salt velocity model building. Society of Exploration Geophysicists Annual Meeting, Houston, 2013, pp 4760–4764.
Huang W, Jiao K, Vigh D, Kapoor J, Watts D, Hongyan L, Derharoutian D and Cheng X 2012. Application of full-waveform inversion for salt sediment inclusion inversion. Society of Exploration Geophysicists Annual Meeting, Las Vegas, 2012, pp 4341–4345.
Husson JM, Maloof AC, Schoene B, Chen CY and Higgins JA 2015. Stratigraphic expression of Earth’s deepest δ13C excursion in the Wonoka Formation of South Australia. American Journal of Science 315(1):1–45. doi:10.2475/01.2015.01.
Jackson M and Hudec M 2017. Minibasins. In Salt tectonics: principles and practice. Cambridge University Press, pp 155–180. doi:10.1017/9781139003988.010.
Jackson MPA and Talbot CJ 1991. A glossary of salt tectonics, Bureau of Economic Geology Geological Circular 91-4. The University of Texas at Austin.
Jenkins RJF 1981. The concept of an ‘Ediacaran period’ and its stratigraphic significance in Australia. Transactions of the Royal Society of South Australia, 105:179–194.
Klaebe RM 2015. The palaeoenvironmental context of Neoproterozoic carbon isotope excursions. PhD thesis, University of Adelaide. doi:10.4225/55/5837d665da2ed.
Kernen RA 2011. Halokinetic sequence stratigraphy of the Neoproterozoic Wonoka Formation at Patawarta Diapir, central Flinders Ranges, South Australia. Unpublished master’s thesis, New Mexico State University, Las Cruces.
Kernen RA, Giles KA, Lawton TF, Rowan MG and Hearon TE IV 2012. Depositional and halokinetic sequence stratigraphy of the Neoproterozoic Wilpena Group adjacent to Patawarta allochthonous salt sheet, central Flinders Ranges, South Australia. In Alsop GI, Archer SG, Hartley AJ, Grant NT and Hodgkinson R eds, Salt tectonics, sedimentation and prospectivity, Special Publications 363. Geological Society of London, pp 81–105. doi:10.1144/SP363.5.
Kernen RA, Giles KA, Poe P, Gannaway CE, Rowan MG, Fiduk JC and Hearon TE 2019. Origin of the rim dolomite as lateral carbonate caprock, Patawarta salt sheet, Flinders Ranges, South Australia. Australian Journal of Earth Sciences 67(6):815–832. doi:10.1080/08120099.2019.1588695.
Knauth LP and Kennedy MJ 2009. The late Precambrian greening of the Earth. Nature 460:728–732. doi:10.1038/nature08213.
Le Guerroué E 2010. Duration and synchroneity of the largest negative carbon isotope excursion on Earth: the Shuram/Wonoka anomaly. Comptes Rendus Geoscience 342(3):204–214. doi:10.1016/j.crte.2009.12.008.
Lehrmann A, Kernen RA, Giles S and Giles K 2017. Timing of allochthonous salt emplacement of the Neoproterozoic (Ediacaran) Patawarta salt sheet, Flinders Ranges, South Australia: evidence from the subsalt minibasin. Geological Society of America South Central Annual Conventions Abstracts Volumes, San Antonio, Texas.
Lemon NM 1988. Diapir recognition and modelling with examples from the late Proterozoic Adelaide Geosyncline, central Flinders Ranges, South Australia. PhD thesis, University of Adelaide.
Li Z, Ji S, Bai B, Wu Q and Han W 2011. Dirty salt tomography using RTM 3D angle gathers. SEG Technical Program Expanded Abstracts 2011. Society of Exploration Geophysicists. doi:10.1190/1.3628046.
Marton G, Tari G and Lehmann C 2000. Evolution of the Angolan passive margin, West Africa, with emphasis on post-salt structural styles. In Mohriak W and Talwani M eds, Atlantic rifts and continental margins, Geophysical Monograph Series 115. American Geophysical Union, pp 129–149. doi:10.1029/GM115p0129.
Mawson D and Sprigg RC 1950. Subdivision of the Adelaide System. Australian Journal of Science 13:69–72.
Mohriak WU, Nemčok M and Enciso G 2008. South Atlantic divergent margin evolution: rift-border uplift and salt tectonics in the basins of SE Brazil. In Pankhurst RJ, Trurow RAJ, Briton Neves BB and De Wit MJ eds, West Gondwana: pre-Cenozoic correlations across the South Atlantic region, Special Publications 294. Geological Society of London, pp 365–398. doi:10.1144/SP294.19.
Murrell B 1977. Stratigraphy and tectonics across the Torrens Hinge Zone between Andamooka and Marree, South Australia. BSc thesis, Victoria University of Wellington.
Peles O, Bartana A, Kosloff D and Koren Z 2004. Limitations of the exploding reflector model in sub-salt imaging. SEG Technical Program Expanded Abstracts 2004. Society of Exploration Geophysicists. doi:10.1190/1.1851245.
Preiss WV 2000. The Adelaide Geosyncline of South Australia and its significance in Neoproterozoic continental reconstruction. Precambrian Research 100(1–3):21–63. doi:10.1016/S0301-9268(99)00068-6.
Rowan MG and Vendeville BC 2006. Foldbelts with early salt withdrawal and diapirism: physical model and examples from the northern Gulf of Mexico and the Flinders Ranges, Australia. Marine and Petroleum Geology 23(9–10):871–891. doi:10.1016/j.marpetgeo.2006.08.003.
Rowan MG, Hearon TE, Kernen RA, Giles KA, Gannaway CE, Williams NJ and Hannah PT 2020. A review of allochthonous salt tectonics in the Flinders and Willouran ranges, South Australia. Australian Journal of Earth Sciences 67(6):787–813. doi:10.1080/08120099.2018.1553063. doi:10.1080/08120099.2018.1553063
Roy A and Chazalnoel N 2011. RTM technology for improved salt imaging in the Santos Basin, Brazil. SEG Technical Program Expanded Abstracts 2011. Society of Exploration Geophysicists. doi:10.1190/1.3627869.
Schmid S 2017. Neoproterozoic evaporites and their role in carbon isotope chemostratigraphy (Amadeus Basin, Australia). Precambrian Research 290:16–31.
Schrag DP, Higgins JA, Macdonald FA and Johnston DT 2013. Authigenic carbonate and the history of the global carbon cycle. Science 339(6119):540–543. doi:10.1126/science.1229578.
Sprigg RC 1952. Sedimentation in the Adelaide Geosyncline and the formation of a continental terrace. In Glaessner MF and Rudd EA eds, Sir Douglas Mawson anniversary volume. University of Adelaide, pp153–159.
Swart PK and Kennedy MJ 2012. Does the global stratigraphic reproducibility of δ13C in Neoproterozoic carbonates require a marine origin? A Pliocene–Pleistocene comparison. Geology 40(1):87–90. doi:10.1130/G32538.1.
Stüeken EE, Buick R and Lyons TW 2019. Revisiting the depositional environment of the Neoproterozoic Callanna Group, South Australia. Precambrian Research 334(20):105474. doi:10.1016/j.precamres.2019.105474.
Walker RG and Plint AG 1992. Wave- and storm-dominated shallow marine systems. In Walker RG and James NP, Facies models response to sea level change, GeoText 1. Geological Association of Canada, pp 219–238.
Williams NJ 2017. Structural evolution and paleohydrology of a Tertiary salt weld, Willouran Ranges, South Australia. Unpublished master’s thesis, Northern Illinois University.


