John O’Donnell1, Stephan Thiel1, 2, Kate Robertson1, Alexei Gorbatov3 and Caroline Eakin4
1 Geological Survey of South Australia, Department for Energy and Mining
2 School of Earth and Environmental Sciences, University of Adelaide
3 Geoscience Australia
4 Research School of Earth Sciences, Australian National University
Download this article as a PDF (1.4 MB); cite as MESA Journal 93, pages 24–31
Published October 2020
Introduction
Cratonic margins are recognised as a first-order control on camp-scale mineralisation (e.g. Begg et al. 2010; Mole et al. 2015), with implications for prospectivity mapping and ore genesis modelling (e.g. Griffin et al. 2013). Hence the UNCOVER initiative’s identification of illuminating detailed 3D lithospheric architecture as a key priority for enhancing the probability of successful mineral exploration under cover.
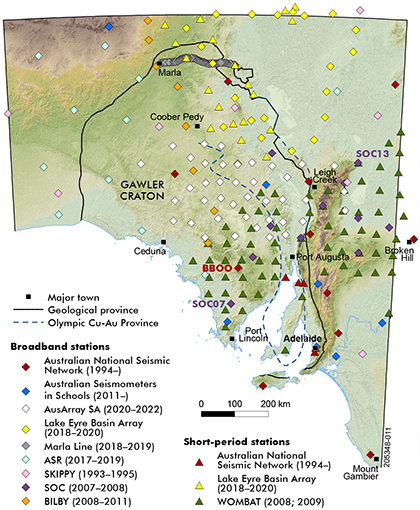
Passive seismology, and tomography especially, has been at the forefront of illuminating deep earth structure for decades. In particular, the faster passage of seismic waves through cold, depleted cratons relative to, say, Proterozoic fold belts or Phanerozoic lithosphere provides a means of delineating cratons in 3D (e.g. Lebedev et al. 2009). Seismic data from preceding sparse broadband arrays in South Australia (e.g. SKIPPY, SOC, BILBY; Fig 1) illuminate lithospheric velocity structure at a length scale of ~3° (e.g. Kennett et al. 2013). However, this is insufficient to delineate the detailed lithospheric architecture (terrane margins, translithospheric faults, sutures and shear zones etc.) needed for robust prospectivity mapping. Dense seismic arrays in the southeast of the state (e.g. WOMBAT; Fig 1) have helped to mitigate this deficiency (e.g. Rawlinson et al. 2014), but the narrowband sensors used were insensitive to the data-rich low frequency surface waves that are a mainstay of probing lithospheric velocity structure.
To this end, the Geological Survey of South Australia is poised to deploy the AusArray SA broadband seismic array across the eastern-central Gawler Craton (Fig 1), a region encompassing the metallogenic Olympic Cu–Au Province (e.g. Reid 2019; Skirrow et al. 2007). The seismic array will acquire broadband data at the same station spacing (~0.5° x 0.5°) as the AusLAMP magnetotelluric array. The seismic array will comprise 29 Nanometrics Trillium Compact 120 s sensors (25 from the Australian National Seismic Imaging Resource, ANSIR, and 4 from Geoscience Australia) and 12 Trillium Compact 25 s sensors (from ANSIR). These sensors will record ground motion at periods between 0.01 and 120 s, and between 0.01 and 25 s, respectively.
The Neoproterozoic and Phanerozoic sediment overlying most of the Olympic Cu–Au Province, and the Gawler Craton more broadly, necessitates a reliance on geophysical data for exploration. In this regard magnetotelluric probing has provided invaluable images of lithospheric electrical resistivity structure and associated deep signatures of mineral systems (e.g. Robertson et al. 2016; Thiel and Heinson 2013), with significant exploration implications (e.g. Heinson et al. 2018). The AusArray SA broadband seismic array promises fresh perspective. Like magnetotelluric data, seismic data is sensitive to factors including temperature, composition, fluids and melt. Critically, the contrasting sensitivities of magnetotelluric and seismic data to these factors will facilitate progress in distinguishing between these contributions in the geophysical signals, and this, in essence, is the over-arching goal of geophysical earth sounding.
In the following sections, we provide a brief overview of seismic techniques we will bring to bear on illuminating the seismic structure of the eastern-central Gawler Craton, with a particular emphasis on flavours of tomography. We emphasise that this is a discussion of techniques and their idiosyncrasies rather than a description of the current understanding of the seismic structure of the eastern-central Gawler Craton.
Seismic tomography
Seismic tomography refers to the inference of 3D velocity structure via the illumination of a target volume with seismic energy from all possible azimuths (and inclinations, if applicable). Given the relative seismic quiescence of the Australian continent, the AusArray SA tomography modelling will draw predominantly on two energy sources: (i) ballistic waves from distant, teleseismic earthquakes; and (ii) diffuse ambient noise field. We start with traditional earthquake tomography.
Teleseismic body wave tomography
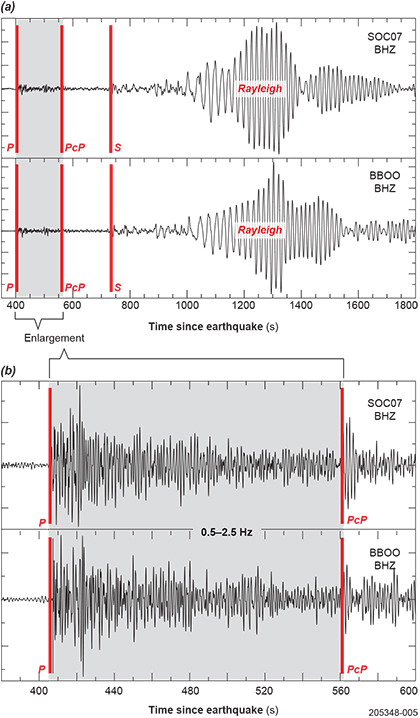
When an earthquake occurs, compressional (P) and shear (S) body waves radiate outward from the source, travelling through earth’s interior and becoming imprinted with structural information according to their paths. Figure 2a shows vertical-component seismograms from broadband stations SOC07 (Lock) and BBOO (Buckleboo) in South Australia (see Fig 1 for locations) recording energy from a magnitude 6.6 earthquake that occurred offshore New Zealand in December 2007. Three selected body wave phases are marked on the seismograms: the direct P-wave, the PcP phase representing P-wave energy that has bounced once off the core-mantle boundary, and the direct S-wave (see Fig 3 for an illustration of these paths).
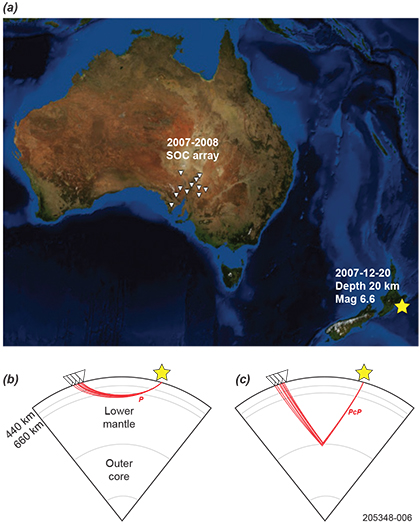
Accurately modelling earthquake-to-station travel times of deep-plunging body waves like these in a 3D heterogeneous earth is a considerable numerical challenge. That we are often only interested in the travel time signal associated with a specific target volume (e.g. the subarray lithosphere) makes the problem tractable; the challenge is reduced to isolating and modelling the travel times accrued within the target volume. Teleseismic relative arrival time body wave tomography is predicated on the assumption that individual ray paths only diverge from an essentially common ray path in a volume locally beneath the seismic array (Fig 3; equivalently, the area element of wavefront encompassing the cluster of ray paths shrinks as it is projected back toward the earthquake source). This assumption provides a means of isolating the sought travel times associated with the subarray target volume.
Figure 2 (a) Vertical-component velocity seismograms showing body and surface waves from a magnitude 6.6 earthquake occurring offshore New Zealand (see Fig 3) in December 2007 at stations SOC07 and BBOO in South Australia. The predicted arrival times of selected body wave phases (P, PcP and S) according to 1D earth model ak135 are marked in red; the larger amplitude surface (Rayleigh) wave trails these body wave phases. (b) Close-up of P and PcP phases in the 0.5–2.5 Hz frequency band. The complex ‘coda’ lagging the direct P-wave arrival represents a combination of other phases and scattered energy.
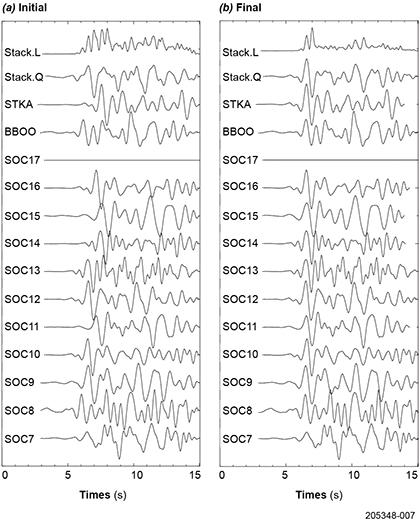
One dimensional earth models such as ak135 (Kennett et al. 1995) generally predict phase arrivals within several seconds of observed arrivals (see Fig 2), a testament to decades of painstaking seismological analysis and inference of the earth’s gross interior structure. Across a seismic array, the travel time discrepancies (differences between observations and ak135 predictions) reflect a combination of: (i) uncertainty in the earthquake origin time and hypocentre; (ii) deviation of actual velocity structure from 1D ak135 along the assumed common ray path; and (iii) local heterogeneity in the subarray volume where the ray paths have diverged. As alluded to before, without modelling the absolute earthquake-to-station travel times in a 3D heterogeneous earth we cannot know the relative contributions of (i) and (ii) to the travel time discrepancies. However, under the common ray path assumption, contributions (i) and (ii) will be the same for each station of the array. It follows that the imperfect alignment of observed phases according to predicted ak135 phase arrival times (i.e. following the ak135 moveout correction) can be attributed to contribution (iii) (Fig 4a). At this juncture waveform similarity (rooted in the common ray path) can be exploited to infer the additional time shifts needed to optimally align the observed phases (Fig 4b). These time shifts, or relative arrival times, are the sought contribution (iii) used to model the 3D subarray velocity structure in teleseismic relative arrival time tomography. The caveat is that relative arrival times can only be used to infer relative velocity variations; this is the cost of circumventing travel time contributions (i) and (ii).
The common ray path assumption can only be true at large earthquake-array distances, with ~30° held to be the threshold epicentral distance above which the assumption holds – the implication being that earthquakes occurring within ~30° of an array must be excluded from teleseismic relative arrival time tomography. Beyond this distance threshold, body wave phases arrive at the array subvertically (e.g. Fig 3). In terms of tomographic imaging, this means that lateral structural resolution is good (in practice limited only by the station spacing), but vertical resolution suffers from the preponderance of subvertical rays. This is the cause of the vertical smearing that is ubiquitous in teleseismic body wave tomography. Nevertheless, the lateral resolution of (relative) velocity structure offered by these high-frequency body waves (frequencies of order 0.1–10 Hz) impacting dense arrays is extremely informative, and the vertical smearing can be mitigated to an extent by including independent information (e.g. constraints from surface wave tomography; joint inversion).
Figure 3 (a) Location of magnitude 6.6 earthquake offshore New Zealand that was recorded on Structure of Cratons (SOC) broadband stations in South Australia. The average SOC station-earthquake epicentral distance is ~33°. Ray paths of (b) P and (c) PcP body wave phases to the individual SOC stations calculated for the 1D ak135 earth model. Relative arrival time body wave tomography is predicated on the assumption that individual ray paths only diverge from an essentially common ray path within a volume underlying the seismic array.
Figure 4 Teleseismic waveform similarity is exploited to accurately determine relative arrival times. (a) Truncated seismograms containing the P-wave arrivals of the earthquake described in Figure 2 at SOC and ANSN stations (SOC17 was not operating at this time). The seismograms are initially aligned according to the predicted ak135 P-wave arrival times at each station. The imperfect alignment reflects 3D structural heterogeneity beneath the seismic array that is not accounted for by the 1D ak135 earth model. (b) The adaptive stacking algorithm iteratively shifts the individual seismograms to maximise alignment coherence. The inferred time shifts are used in teleseismic relative arrival time tomography to model the subarray 3D velocity structure.
Surface wave tomography
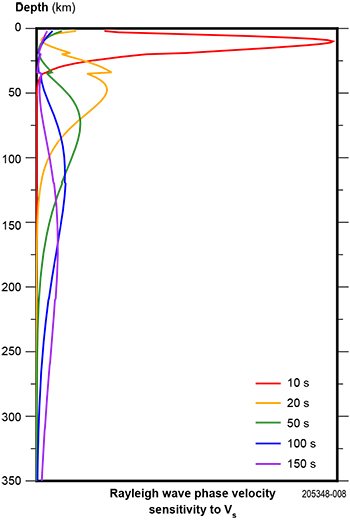
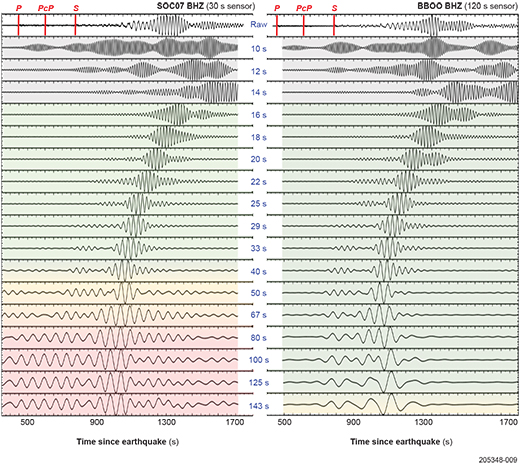
Lagging the body wave arrivals in Figure 2 is the conspicuous Rayleigh wave. Rayleigh waves, along with Love waves, are surface waves – they are the manifestation of body wave energy interacting with, and trapped near, the earth’s surface. Compared to body waves, surface waves have significantly larger amplitudes (energy dispersal is over a surface rather than through a volume), a lower frequency content and are strongly dispersive – i.e. their velocity varies with frequency. Their (geometric) dispersion reflects their deepening sensitivity to earth structure with decreasing frequency, or equivalently, with increasing period. This provides a means of constraining earth structure at different depths. Sensitivity to a depth interval at a given frequency means that it does not make sense to speak of, say, the shear velocity of a surface wave; rather we measure the group and/or phase velocities of surface waves, which in turn encode depth-integrated shear velocity structure (surface waves are much less sensitive to compressional velocity structure). For example, Figure 5 shows the depth sensitivity of Rayleigh wave phase velocities to shear velocity structure as a function of period for the 1D ak135 earth model, illustrating why Rayleigh waves at periods of ~20–120 s are a mainstay for probing lithospheric structure. In contrast to teleseismic body waves, which arrive subvertically, surface wave peaks and troughs can be tracked as they transit laterally across a seismic array, and this facilitates determination of absolute velocity structure between stations. Performing this analysis at different periods permits the inference of absolute velocity structure at different depths. Figure 6 shows vertical-component seismograms associated with the earthquake described in Figure 2 at two broadband stations in South Australia. The dependence of velocity upon frequency is readily apparent in the raw seismograms: the lower frequency Rayleigh wave energy arrives earlier than the higher frequency energy. This is emphasised when the seismograms are viewed in progressively lower frequency bands. Figures 5 and 6 also highlight the advantage of a 120 s sensor (BBOO) over a 30 s sensor (SOC07) for surface wave analyses in regions of thick lithosphere, such as the Gawler Craton.
Figure 6 Raw vertical-component velocity seismograms (top) associated with the earthquake described in Figure 2 for broadband stations SOC07 and BBOO stations viewed in a sequence of 10 mHz wide frequency bands with centre periods ranging from 10 to 143 s. The group velocity in a given frequency band is the velocity at which the overall wavelet envelope travels, while the phase velocity is the velocity at which an individual phase of the wave (e.g. a peak or trough) travels. The sensor at SOC07 is capable of faithfully recording waveforms to periods of 30 s, that at BBOO to periods of 120 s. Beyond these limits their sensitivities decrease. Green shading indicates waveforms recorded within the optimal frequency remit of the instruments; orange shading indicates useable waveforms at frequencies just beyond the optimal remit of the instruments; red shading indicates waveforms which are severely contaminated by long-period noise amplified through unstable instrument response deconvolution at frequencies far beyond the optimal remit of the instrument. Grey shading highlights the complexity of teleseismic surface waves at periods below ~20 s (safely within the optimal frequency remit of the instruments).
Ambient noise tomography
Shorter period (typically less than ~20 s) surface waves transiting in the more compositionally heterogeneous crust are subject to more scattering and diffraction – the longer the propagation path, the greater the wavefield complexity accumulated. This renders teleseismic surface waves at periods less than ~20 s difficult to interpret (Fig 6, grey shading).
Ambient seismic noise refers to the diffuse energy field excited by ocean swells and infragravity waves interacting with the seafloor (e.g. Rhie and Romanowicz 2004). Its spectral power is highest in the primary (~10–20 s) and secondary (~5–10 s) microseismic bands (e.g. Yang and Ritzwoller 2008). Ambient noise correlation exploits the fact that the approximate impulse response of the earth between two stations (i.e. the Green’s function) emerges from the cross-correlation of noise records (e.g. Shapiro and Campillo 2004). In effect, one seismic station serves as a local, virtual earthquake source for the other, and vice versa. This means that established techniques of earthquake seismology (e.g. surface wave dispersion analyses) can be applied to the noise correlation functions (e.g. Shapiro et al. 2005). In the case of Australia, this circumvents reliance on complex teleseismic surface waves (i.e. those at periods less than 20 s) for probing crustal structure.
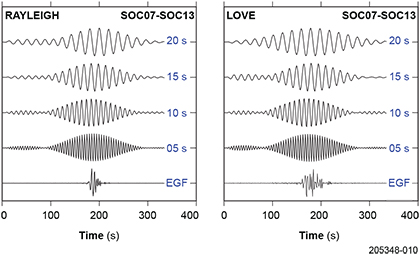
Figure 7 shows empirical Rayleigh and Love wave Green’s functions derived from the cross-correlation and stacking (summing) of 30 days of continuous seismic data in 1 hour chunks for station pair SOC07 and SOC13 (see Fig 1 for locations). Note the simplicity of the noise-extracted surface waves relative to teleseismic counterparts at comparable periods in Figure 6, which motivates the use of ambient noise in imaging crustal structure.
Figure 7 Rayleigh and Love wave empirical Green’s functions (EGF) for station pair SOC07-SOC13 (see Fig 1 for locations) determined by stacking 30 days of vertical and transverse component symmetric noise cross-correlograms, respectively. Similar to Figure 6, the EGFs are shown in four 10 mHz wide frequency bands with centre periods ranging from 5 to 20 s.
Tomography combined
We will use the combination of ambient noise and teleseismic surface wave data record on the AusArray SA broadband stations to constrain the absolute shear velocity structure of the crust and uppermost mantle underlying the central-eastern Gawler Craton (and beyond using existing seismic data, e.g. SOC). As surface wave period increases, lateral structural resolution will progressively increase from length scales of several 10s of kilometres in the crust to several 100s of kilometres in the upper mantle. We will then superimpose the granular, relative velocity variations inferred by teleseismic body wave travel time analysis upon the longer wavelength absolute velocity structure inferred by teleseismic surface wave and ambient noise analyses to leverage both data types.
The teleseismic tomography is of course dependent on recording high-quality earthquake data. Unless rupturing is complex and protracted, the larger the earthquake, the better the signal. On average, about two magnitude 6 earthquakes occur per week worldwide. However, not all will be located according to the needs of a survey, and tomographic resolution hinges on illuminating the array with seismic energy from as many azimuths as possible (ideally uniformly). A recording period of at least 1 year is desirable to garner sufficient high-quality teleseisms for tomographic imaging.
While the ambient noise analysis is not dependent on the occurrence of earthquakes, a minimum recording period of at least 1 year is nevertheless desirable – the noise-inferred empirical Green’s function can only be said to represent the true Green’s function for an azimuthally uniform distribution of noise sources. This condition is rarely, if ever, truly satisfied. In the case of South Australia, the Southern Ocean is the dominant noise source; a much weaker signal is incident from the continental interior. Recording over the course of a year means that an annual seasonal and sea-state cycle can be sampled (e.g. Southern Ocean storms in winter, the northern monsoon and cyclone season over the summer), helping to mitigate the noise directivity asymmetry. Beyond that consideration, the signal-to-noise ratio of the empirical Green’s function increases with recording duration (e.g. Bensen et al. 2007).
Complementary passive seismic tools for lithospheric probing
The preceding discussion has focused on 3D tomographic imaging. However, we will also use a host of other techniques to help shed light on the crust and upper mantle underlying the eastern-central Gawler, including receiver function, seismic anisotropy and seismicity analyses.
Receiver functions
When an upcoming P-wave encounters a significant impedance contrast like the crust–mantle transition (Moho), a portion of the P-wave energy is converted to an S-wave. The time lag between the direct P-wave (faster) and converted S-wave (slower) arrivals as recorded at an overlying station then reflects the depth to the impedance contrast in question. So-called seismic receiver functions are seismograms which have been processed to isolate and emphasise these direct and converted phases (e.g. Burdick and Langston 1977). Receiver function analysis finds widespread application in mapping Moho depths, but more subtle impedance contrasts like the sedimentary cover – basement interface, mid-lithospheric discontinuity and lithosphere–asthenosphere boundary can be targeted (e.g. Clitheroe et al. 2000; Fordet al. 2010; Selway et al. 2015)
Seismic anisotropy
The concerted alignment of the mineral olivine is the primary contributor to upper mantle seismic anisotropy – the directional dependence of seismic velocity – whether it be in the form of frozen ‘fossil’ deformation in the lithospheric mantle, or active flow in the asthenosphere (e.g. Long and Becker 2010). Measurements of seismic anisotropy thus provide a window into past and present deformational processes, and can therefore inform models of ore genesis. One manifestation of anisotropy in the earth’s mantle is the splitting of S-waves into orthogonally polarised fast and slow components. The orientation of the fast polarisation direction and the accumulated delay time between the fast and slow components reflect the geometry and strength, respectively, of the anisotropy. The SKS phase – an S-wave transmitted through the core as a P-wave, with conversion to S-wave again at re-emergence from the core – is particularly well suited to studying upper mantle anisotropy. Other manifestations of anisotropy are the so-called Rayleigh-Love discrepancy – the difference in velocity between horizontally polarised Love and vertically polarised Rayleigh waves – and azimuthal anisotropy – the directional variability of wave velocity with azimuth.
Seismicity
The AusArray SA array will also enable enhanced regional seismicity mapping. Also, the Woomera Range Complex may opportunistically offer valuable calibration data. While the delineation of fault systems and fluid pathways is desirable from a mineral exploration perspective, it also serves to inform seismic hazard modelling. Although far removed from an active plate margin, parts of South Australia, the Flinders Ranges in particular, are subject to considerable low-level seismicity (e.g. Pilia et al. 2013). This is occasionally punctuated by significant earthquakes (e.g. magnitude 6.0 at Warooka in 1902).
The new frontier: passive seismic imaging of the upper crust
The emergence of ambient noise tomography in the mid-2000s heralded a mini-revolution in seismology. It is remarkable that structural information is nowadays routinely extracted from recordings of seemingly incoherent seismic noise. Another facet of noise correlation analysis sets it apart from earthquake seismology: the continuous noise recordings can encode temporal variations in velocity structure. Such temporal changes might reflect, for example, changes in groundwater level (e.g. Lecocq et al. 2017). The seismic ambient noise field could therefore be exploited as a long-term monitor of, for instance, the Great Artesian Basin.
A mini-revolution currently unfolding is ‘large-N’ array seismology. This refers to dense, targeted arrays of nodal seismometers (compact, all-in-one 3-channel sensor datalogger with onboard GPS timing and battery) that extend noise tomography resolution of uppermost crustal structure (shallower than 1 km) to length scales of order ~100 m (e.g. Lin et al. 2013). Such an array of nodal seismometers has recently become part of the ANSIR instrument pool. Active source seismic data is the gold standard in upper crustal imaging, but ‘large-N’ array passive seismology is closing the gap, and at a fraction of the cost.
Toward thermochemical tomography of the Gawler Craton
Disentangling the contributions of chemistry and temperature in geophysical signals is a persistent barrier to a fuller understanding of lithospheric structure and evolution. Because seismic and magnetotelluric data have contrasting sensitivities to temperature and composition, the combination of these complementary data at a similar resolution offers the promise of distinguishing between thermal and compositional signals. In particular, signatures of metasomatism and fluid pathways – primary indicators of mineral prospectivity – should be more readily identifiable. The AusArray SA seismic data will ultimately be incorporated into the LitMod joint inversion modelling formalism (e.g. Afonso et al. 2016) to infer the 3D thermochemical structure of the Gawler Craton as part of the ARC Linkage grant ‘Illuminating AusLAMP: thermodynamics inversion for mineral systems’, which the Geological Survey of South Australia is a collaborator of. The project commenced this year and will directly benefit from the outputs of AusArray SA.
Deployment of the AusArray SA seismic array was due to commence in April 2020, but was postponed to later in 2020 due to the COVID-19 pandemic. Once deployed, the array will record continuously for at least 15 months to obtain sufficient earthquake and noise data for modelling purposes. The raw seismic data will be housed on the AusPass passive seismic data server and the derived model outputs will be made available on the South Australian Resources Information Gateway (SARIG).
Accessing data
Data currently available on AusPass:
- Australian Seismometers in Schools, doi:10.7914/SN/S1
- SKIPPY, doi:10.7914/SN/7B_1993
- SOC, doi:10.7914/SN/7K_2007
- BILBY, doi:10.7914/SN/6F_2008
- WOMBAT – Gawler, doi:10.7914/SN/1G_2008
- WOMBAT – Curnamona, doi:10.7914/SN/1F_2009.
Data to be available on AusPass:
- AusArray SA, doi:10.7914/SN/6K_2020
- Lake Eyre Basin, doi:10.7914/SN/5G_2018
- Marla Line, doi:10.7914/SN/3G_2018.
Australian National Seismic Network data is available at the Incorporated Research Institutions for Seismology Data Management Center (IRISDMC).
References
Begg GC, Hronsky JA, Arndt NT, Griffin WL, O’Reilly SY and Hayward N 2010. Lithospheric, cratonic, and geodynamic setting of Ni-Cu-PGE sulfide deposits. Economic Geology 105(6):1057–1070. doi:10.2113/econgeo.105.6.1057.
Burdick LJ and Langston CA 1977. Modeling crustal structure through the use of converted phases in teleseismic body-wave forms. Bulletin of the Seismological Society of America 67(3):677–691.
Clitheroe G, Gudmundsson O and Kennett BLN 2000. Sedimentary and upper crustal structure of Australia from receiver functions. Australian Journal of Earth Sciences 47(2):209–216. doi:10.1046/j.1440-0952.2000.00774.x.
Ford HA, Fischer KM, Abt DL, Rychert CA and Elkins-Tanton LT 2010. The lithosphere–asthenosphere boundary and cratonic lithospheric layering beneath Australia from Sp wave imaging. Earth and Planetary Science Letters 300(3–4):299–310. doi:10.1016/j.epsl.2010.10.007.
Griffin W, Begg G and O’Reilly SY 2013. Continental-root control on the genesis of magmatic ore deposits. Natural Geoscience 6(11):905–910. doi:10.1038/ngeo1954.
Lebedev S, Boonen J and Trampert J 2009. Seismic structure of Precambrian lithosphere: new constraints from broad-band surface-wave dispersion. Lithos 109(1–2):96–111. doi:10.1016/j.lithos.2008.06.010.
Lin F-C, Li D, Clayton RW and Hollis D 2013. High-resolution 3D shallow crustal structure in Long Beach, California: application of ambient noise tomography on a dense seismic array. Geophysics 78(4):Q45-Q56. doi:10.1190/geo2012-0453.1.
Long MD and Becker TW 2010. Mantle dynamics and seismic anisotropy. Earth and Planetary Science Letters 297(3–4):341–354. doi:10.1016/j.epsl.2010.06.036.
Mole DR, Fiorentini ML, Cassidy KF, Kirkland CL, Thebaud N, McCuaig TC, Doublier MP, Duuring P, Romano SS, Maas R, Belousova EA, Barnes SJ and Miller J 2015. Crustal evolution, intra-cratonic architecture and the metallogeny of an Archaean craton. Geological Society, London, Special Publications 393(1):23–80. doi:10.1144/SP393.8.
Rawlinson N, Salmon M and Kennett BL 2014. Transportable seismic array tomography in southeast Australia: illuminating the transition from Proterozoic to Phanerozoic lithosphere. Lithos 189:65–76. doi:10.1016/j.lithos.2013.06.001.
Rhie J and Romanowicz B 2004. Excitation of earth’s continuous free oscillations by atmosphere–ocean–seafloor coupling. Nature 431(7008):552–556. doi:10.1038/nature02942.
Robertson K, Heinson G and Thiel S 2016. Lithospheric reworking at the Proterozoic-Phanerozoic transition of Australia imaged using AusLAMP magnetotelluric data. Earth and Planetary Science Letters 452:27–35. doi:10.1016/j.epsl.2016.07.036.
Selway K, Ford H and Kelemen P 2015. The seismic mid-lithosphere discontinuity. Earth and Planetary Science Letters 414:45–57. doi:10.1016/j.epsl.2014.12.029.
Shapiro NM, Campillo M, Stehly L and Ritzwoller MH 2005. High resolution surface-wave tomography from ambient seismic noise. Science 307(5715):1615–1618. doi:10.1126/science.1108339.
Skirrow RG, Bastrakov EN, Barovich K, Fraser GL, Creaser RA, Fanning CM, Raymond OL and Davidson GJ 2007. Timing of iron oxide Cu-Au-(U) hydrothermal activity and Nd isotope constraints on metal sources in the Gawler Craton, South Australia. Economic Geology 102(8):1441–1470. doi:10.2113/gsecongeo.102.8.1441.


