Ignacio González-Álvarez1, Carmen Krapf2, Thomas Albrecht3, Ulrich Kelka1, Cericia Martínez1, Mark Pawley2, Tania Ibrahimi1, Jonathan Irvine2, Anna Petts2, Justin Gum4 and Jens Klump1
1 CSIRO
2 Geological Survey of South Australia, Department for Energy and Mining
3, 4 Consultants associated to CSIRO or Geological Survey of South Australia
Download this article as a PDF (18 MB); cite as MESA Journal 96, pages 4–21
Published March 2022
Introduction
Transported cover and intensely weathered profiles pose a significant technological challenge for mineral exploration worldwide (e.g. UNCOVER 2012; AMIRA 2017; González-Álvarez et al. 2020a and references therein). This is also widely the case in South Australia where >75% of the surface and subsurface is characterised by transported cover and/or intensely weathered profiles (e.g. Wilford et al. 2001; Sheard et al. 2008; Krapf et al. 2012; Tiddy et al. 2019).
Geochemical dispersion/concentration processes throughout cover units can be efficient in a variety of geological–cover contexts. These processes can produce near surface geochemical anomalies in the landscape that may be an expression of a mineral system within basement rock units at depth (e.g. Butt et al. 2005; Anand and Butt 2010).
Basement structures in Earth’s crust are a well-recognised conduit for fluid flow, which can result in the formation of a large variety of mineral deposits (e.g. Solomon and Groves 2000). Therefore, identifying basement structures that may be associated with mineral deposit formation has become an important part of exploration protocols and prospectivity assessments (Porwal et al. 2010).
South Australia possesses widespread basement structures, many of which have been reactivated by neotectonic activity (Clark et al. 2012; Preiss 2019). This may have important implications for landscape evolution, and also on the efficiency of vertical geochemical dispersion processes through the cover. A recent study in the Coompana region on the Nullarbor Plain highlighted the potential significance of these neotectonic features as geochemical ‘pipelines’ that connect basement with the surface (González-Álvarez et al. 2018a; Noble et al. 2018; González-Álvarez et al. accepted). Morris et al. (2018) discussed surface geochemical anomalies associated with structures and neotectonics linking basement and surface structures in the Ngururrpa area of northeastern Western Australia. They demonstrated that mineral systems related to the reactivation of structures at a large-scale can bring fluids to the surface from deeper basement units (e.g. surface fluid circulation, seismic pumping).
This article is a summary of Report Book 2020/00029 (González-Álvarez et al. 2020b) and provides an overview of the workflow to link basement and surface structures. Kelka and Martinez (2019) described a computer-assisted lineament identification process/workflow, which has been applied in the Gawler Craton by Pawley et al. (2021), and further developed by Kelka et al. (accepted). In addition, in this study we explored the applicability of the landscape pattern recognition (LPR) algorithm developed at CSIRO (González-Álvarez et al. 2018a, 2018b; Penreiter et al. 2018; Klump et al. 2018; González-Álvarez et al. 2020b; Albrecht et al. 2021) to map the variability of landscapes at a large scale in the central Gawler Craton, based on digital elevation model (DEM) data that displays the ‘raw’ variability of the landscape surface. We used a computer-assisted workflow to assist with making more objective, time efficient interpretations than previous maps based on domain expert interpretations.
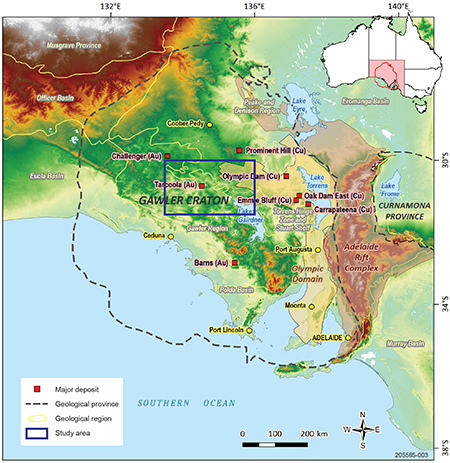
This study also aimed to understand the relationship between the basement fabric and the cover's variability in the central Gawler Craton (Fig 1), and to delineate areas of particular interest in mineral exploration for surface geochemical follow-up (surface and basement lineaments, landscape domains and definition of targets).
Figure 1 Locality map of the Gawler Craton showing the study area on a digital elevation model image (sourced from SARIG 2020a and Geoscience Australia 2009).
Geological context
The central Gawler Craton
The Gawler Craton covers an area of ~450,000 km2 and comprises deformed and metamorphosed sediments and volcanic and plutonic rocks from early Mesoarchean to Mesoproterozoic (3150–1450 Ma; Hand et al. 2007; Fraser et al. 2010; Kositcin 2010). Due to thick sedimentary cover and resulting limited outcrops, the boundary of the Gawler Craton is generally interpreted based on magnetic, gravity and drillhole data (Kositcin 2010). Internally, the Gawler Craton is subdivided into several domains based on contrasts in magnetic, gravity, lithological, structural, geochronological, isotopic and geochemical characteristics (e.g. Ferris et al. 2002; Fairclough et al. 2003; Kositcin 2010).
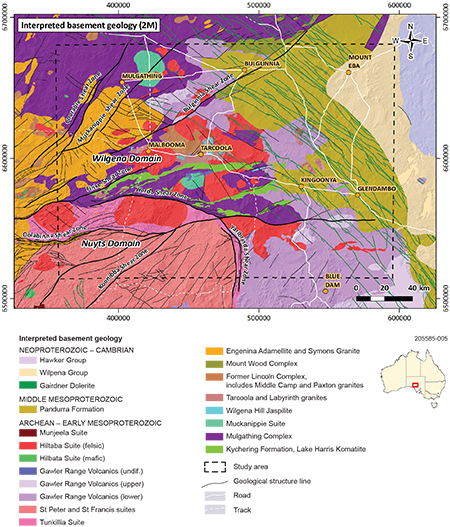
Three geological domains lie in the study area. The Wilgena Domain covers most of the study area and comprises the Mulgathing Complex that has been intruded by Paleoproterozoic to Mesoproterozoic magmatic rocks, overlain by sedimentary and volcanic rocks. The Christie Domain is located to the northwest of the Coorabie Shear Zone in the northwest corner of the study area (Fig 2). The Christie Domain is primarily composed of metasedimentary rocks of the Mulgathing Complex, intruded by minor felsic to mafic intrusions. The Nuyts Domain is located in the southwestern part of the study area, and largely comprises Paleoproterozoic to Mesoproterozoic magmatic rocks.
Basement lithology of the study area
The oldest basement units are part of the late Archean Mulgathing Complex, representing a time span from 2555 to 2410 Ma (Reid et al. 2014; Williams and Reid 2021), and comprise metasediments, banded iron formations, carbonates, and siliceous rocks, as well as felsic and mafic to ultramafic igneous rocks. The Christie Gneiss (c. 2480 Ma; Reid et al. 2014), Glenloth Granite (2507 Ma; Reid et al. 2014) and Kenella Gneiss (c. 2535 Ma; Swain et al. 2005) are exposed in the northwestern and central part of the study area, enclosed by the major shear zones (Fig 2).
Structural framework
The structural framework of parts of the central Gawler Craton has recently been reinterpreted based on the new Gawler Craton Airborne Survey (GCAS) aeromagnetic data (Pawley and Wilson 2019). The Wilgena Domain contains northwest-trending faults that are particularly prominent as narrow demagnetised zones in the magnetic Hiltaba pluton granites. Some faults are relatively straight to curviplanar, and can be traced for >80 km, whereas others are shorter, and form anastomosing to bifurcating structures (Fig 2). The northwest-trending faults typically show apparent dextral offset, and usually cut the major shear zones. An exception to this trend is the north-northeast-trending Tarcoola Fault that appears to propagate from the Finke Shear Zone to the south (Fig 2). Tectonically, the core of the Gawler Craton became relatively stable by c. 1400 Ma. After this time, only minor near-surface movements are recorded within the study area (Sheard et al. 2008).
Mineral systems in the central Gawler Craton
The Gawler Craton is host to several iron oxide – copper–gold (IOGC) ore deposits including Olympic Dam, Prominent Hill, Carrapateena and Oak Dam (Reid 2019). IOCG mineralisation occurs within the Olympic Cu–Au province: a 100–200 km wide north–south trending belt at the eastern margin of the Gawler Craton (Skirrow et al. 2007; Fig 1).
The study area also encompasses the central portion of the Central Gawler Gold Province (Budd and Fraser 2004). This was originally classified as a single Mesoproterozoic mineral system, but may consist of several mineral systems ranging from Archean to Mesoproterozoic in age (Gum 2019). Mineralisation of the region mainly consists of shear-hosted gold systems, which are Cu-poor (Budd and Fraser 2005, and references therein). Ongoing exploration targets in the central Gawler Craton are Au, Cu–Au, Pb–Zn, Fe and Ni in the crystalline basement rocks (Sheard et al. 2008; Gum 2019; Williams and Reid 2021).
Tarcoola
The geology of the Tarcoola goldfield comprises the c. 1715 Ma Paxton Granite that is nonconformably overlain by fluvial to marine sedimentary rocks of the c. 1657 Ma Tarcoola Formation (Budd and Fraser 2004; Daly 1993; Hein et al. 1994). These rocks were subsequently intruded by dykes of the c. 1582 Ma Lady Jane Diorite (Budd and Fraser 2004). Mineralisation at Tarcoola is variable, and thought to be related to the Paxton Granite (Daly 1981) or Lady Jane Diorite (Budd and Skirrow 2007). However, recent work suggests that mineralisation in the Perseverance open pit is younger than the magmatism, the latter of which occurred at c. 1564 Ma (Bockmann et al. 2020).
There is a strong structural control on gold distribution with deformation and mineralisation resulting from north-northwest to south-southeast-directed shortening (Budd and Skirrow 2007; Hughes 1998). The underground workings at the Tarcoola Blocks mine targeted conjugate north-northwest- to north-northeast-trending quartz veins, up to 5 m wide, which are hosted within the interbedded siltstone and quartzite of the Tarcoola Formation (Daly et al. 1990; Hein et al. 1994). Deformation, fluid-flow and disseminated to vein-hosted gold mineralisation occurs in all lithologies in the Perseverance open pit (Wilson et al. 2018).
Landscape and cover context
General landscape setting
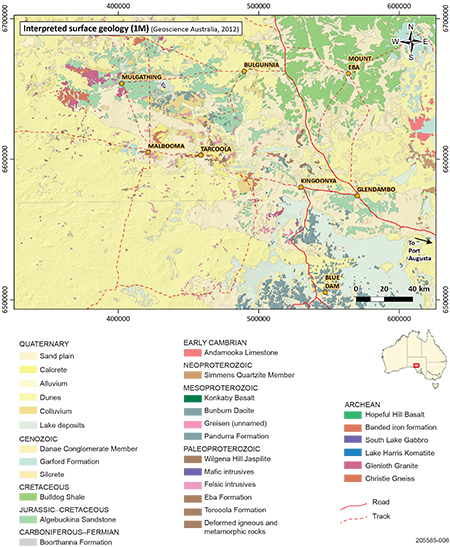
Figure 3 Interpreted surface geological map of the study area (after Geoscience Australia 2012; Raymond et al. 2012).
The Tarcoola region is climatically arid, with a mean temperature in summer >30 °C, annual precipitation of ~175 mm, an evaporation rate >3,000 mm/year, and is dominated by storm rainfall (Bureau of Meteorology). The >20,000 ka groundwater in the Kingoonya Paleovalley is slightly acidic and oxidising, and comparable in salinity to seawater (Figs 3, 4; deeper confined paleovalley thalweg aquifer; Lewis et al. 2013 and references therein).
The surface geology in the study area displays 4 different major regions: (1) southwest and northwest dominated by Quaternary deposits with longitudinal dune fields; (2) southeast dominated by Mesoproterozoic outcrops, and Quaternary lacustrine and sandplain sediments; (3) northeast dominated by the Cretaceous Bulldog Shale, and minor Early Cambrian, Cenozoic and Quaternary deposits; and (4) central–north-central dominated by the Jurassic–Cretaceous Algebuckina Sandstone, with minor outcrops of Archean and Cenozoic deposits (Fig 3; Geoscience Australia 2012; Raymond et al. 2012; Krapf et al. 2012 and 2020).
The topography in the study area ranges from ~80 to ~340 m above sea level, with playa lakes and dry river beds occurring between ~80 and ~125 m, in a total area of ~250 km by ~180 km (Geoscience Australia 2009). The terrain across most of the study area is relatively flat to moderately undulating. Prominent topographic highs are localised around dissected rocky outcrops. The surface is characterised by aeolian sand covering deeply weathered bedrock, mostly in elevated parts of the landscape, or saline playa lakes and drainage tracing topographic lows. A distinct feature is a 120 km longitudinal dune field that occupies an extensive area in the southwestern and southern part of the study area (Fig 3). This area is comprised of individual longitudinal dunes over several kilometres in length, and dune crests mainly trending west–east.
A significant variety of regolith data is available for the central Gawler Craton (e.g. Craig et al. 1999; Lintern and Sheard 1999; Lintern et al. 2000; Wilford et al. 2001; Lintern et al. 2002a, 2002b; Keeling 2004; Lintern and Rhodes 2005; Lintern et al. 2006; Sheard 2008; Sheard et al. 2008; Tiddy et al. 2019). Existing regolith map data for the study area includes the Geological Survey of South Australia’s statewide regolith layer (Krapf et al. 2012), and the 4 CRC LEME regolith maps (Bon Bon – Eba, Half Moon Lake, Eldoah Tank and Tunkillia). As part of this study, a detailed new regolith map for the greater Tarcoola area was compiled (Krapf et al. 2020).
Phanerozoic sedimentary cover
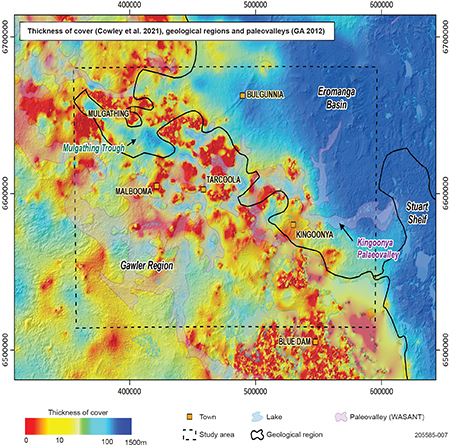
Figure 4 Interpreted thickness of the cover (after Cowley et al.2021) showing main geological features and domains (after Geoscience Australia 2012). The scale is logarithmic to highlight the spatially distinct shallow and deep areas of cover, and to enhance the perception of cover gradient thicknesses. This image was produced using a histogram equalised ArcGIS stretch.
In the study area, the cover comprises Paleozoic, Mesozoic and Cenozoic sedimentary sequences and deeply weathered profiles within the basement rocks. The cover thickness varies throughout the study area, reaching its greatest depth of ~1,400 m in the northeast (e.g. Hibburt 1995; Hou et al. 2003a; Hou et al. 2008; Foss et al. 2019; Cowley et al. 2021; Fig 4).
The oldest preserved cover is the Early Permian to Late Carboniferous post-glacial sediments that reside within the Mulgathing Trough in the northwestern corner of the study area, just south of Mulgathing (Fig 4; Nelson 1976; Hibburt 1995). This >80 km long, northwest-trending trough is filled with Permian glacial sediments that affect the magnetic response (Foss et al. 2019). However, magnetic source depth analysis reveals that the trough is >600 m deep in places, with maximum depths likely not yet detected (Foss et al. 2019).
The Permo-Carboniferous Arckaringa Basin is the oldest cover that unconformably overlies the basement in the study area. Subsidence from the Jurassic to Cretaceous led to the formation of the Eromanga Basin and deposition of fluvial and marine sediments (Algebuckina Sandstone and Bulldog Shale; Figs 2, 3; e.g. Daly et al. 1998; Tiddy et al. 2019; Baudet et al. 2020). Cenozoic sediments unconformably overly sediments of the Eromanga Basin. During the Late Cretaceous to Early Paleogene, a network of large rivers discharged sediment into the marine Eucla Basin to the southwest, filling it with fluvial-estuarine sediments (Alley 1985; Hou 2004). The thickness of the deposits in the paleochannels ranges from a few metres to ~150 m (e.g. Hou 2004). Drier conditions throughout the Pleistocene produced widespread siliceous dunes, dune fields and calcareous sand plains that cover much of the earlier landscape and are up to tens of metres thick (Sheard 2008; Sheard et al. 2008). The modern drainage system is mostly intermittent and discontinuous, or flows into saline playa lakes (e.g. Lewis et al. 2013).
Paleovalley evolution
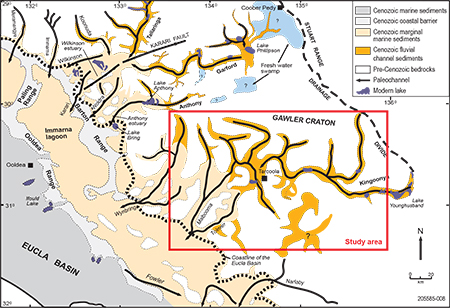
Figure 5 Interpreted paleovalleys and Cenozoic sediment distribution in the Gawler Craton region (after Hou et al. 2000).
In the Cenozoic, paleovalley evolution in the Gawler Craton was significantly affected by the effects of mantle convection, which drew Australia vertically downwards by up to 300 m (Sandiford 2007). This was coupled with differential vertical movement, expressed as a west-side up, east-side down tilting of ~100–200 m (Hou et al. 2003a, 2003b and references therein; Sandiford 2007). The above resulted in significant sedimentary dynamic changes in the Gawler Craton spanning from the Paleocene – Early Eocene (c. 65–50 Ma) to the Pliocene–Quaternary (c. 5–2.5 Ma). Eustatic sea-level changes resulted in flooding of paleovalleys up to 400 km inland of the present coastline (Hou et al. 2008 and references therein; Fig 5).
Hou et al. (2003a) suggested that the incision of the paleovalleys in the region commenced in the Late Cretaceous – Middle Eocene (c. 100–50 Ma), after the subsidence of the Eucla Basin. During the Middle Eocene this incision appears to have accelerated, which continued into the Late Eocene (c. 40 Ma), resulting in the most extensive marine influence on the paleovalleys. In the Late Miocene – Early Pliocene (10–3.5 Ma), the paleovalleys were fragmented into chains of saline lakes. Large volumes of clay were deposited, and along with the lack of sand-sized sediment in the fluvial facies indicates that the landscape was characterised by low relief and low-energy water flows (Hou et al. 2003a).
Contextualisation of results and interpretations
To evaluate if there are links between basement and surface structures present in the central Gawler Craton, a variety of datasets have been compiled and investigated using different methods, including some developed as part of this project. These are summarised in detail in González-Álvarez et al. (2020b).
Surface and basement lineament identification
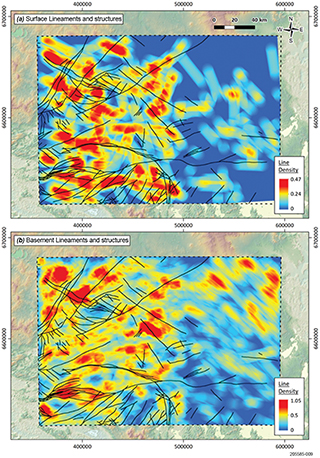
Figure 6 Lineament density maps. (a) Surface manual surface lineaments density. (b) Line density map for basement computer-assisted basement lineaments. Both images present interpreted structures from Pawley and Wilson (2019) as black lines. Red corresponds to a greater number of lineaments and blue corresponds to fewer lineaments.
Surface lineaments are linear elements that are individual and composite alignments at the Earth's surface (e.g. topography, surface drainage, landforms, natural vegetation). Surface lineaments display pattern breaks that the human eye can depict (Boucher 1997). This is dependent on the datasets selected, the accuracy and visual display, as well as on the person’s visual ability and technical experience. Hence the ability to accurately map the presence and location of surface lineaments can vary significantly between individuals (e.g. Andrews et al. 2020; Shipton et al. 2020). However, direct observation based surface lineament mapping has been widely applied in geoscience (e.g. Wise 1982; Boucher 1997; Koch and Mather 1997; Sahoo et al. 2000; Tiren 2010; Clark et al. 2012; Elmahdy et al. 2012; Elmahdy and Mohamed 2014). The identification of lineaments has been improved by the increasing availability of high-resolution satellite images, as well as DEM datasets (Fig 6).
Many surface lineaments are surficial manifestations of basement geological structures, such as fractures and faults. Morris et al. (2018) reported that one regional-scale fault was efficient at vertically dispersing the buried geochemical footprint of a sedimentary exhalative deposit (Ngururrpa area, northeastern Western Australia). Several researchers have described neotectonic activity and its implications on landscape and DEM surface features (e.g. Tokarev et al. 1999; Sandiford 2003; Sandiford et al. 2009; Clark 2010; Quigley et al. 2010; Clark et al. 2011; Clark et al. 2012).
Numerous linear fault scarps that cut the Nullarbor Plain have been mapped from DEM data (Sandiford 2007; Sandiford and Quigley 2009; Clark et al. 2012). These fault scarps are interpreted to preserve a neotectonic record (Clark et al. 2012). Krapf and Irvine (2018) compiled 2 linear surface feature datasets for the Coompana area based on direct DEM observations. These surface lineaments mirror the fabric of the underlying magnetic basement through several hundred metres of cover (Foss et al. 2017; Krapf and González-Álvarez 2018; González-Álvarez et al. 2018b; Noble et al. 2018). These lineaments may represent the surface expression of neotectonic movements that have reactivated deep-seated structural features. Importantly, these fault networks may provide pathways for fluids to vertically disperse through the overlying cover and create geochemical footprints at surface if mineralisation is present below in the basement. Therefore, in regions with extensive and highly variable cover, the mapping of surface lineaments can be a useful tool for mineral exploration (González-Álvarez et al. 2020b, 2020c).
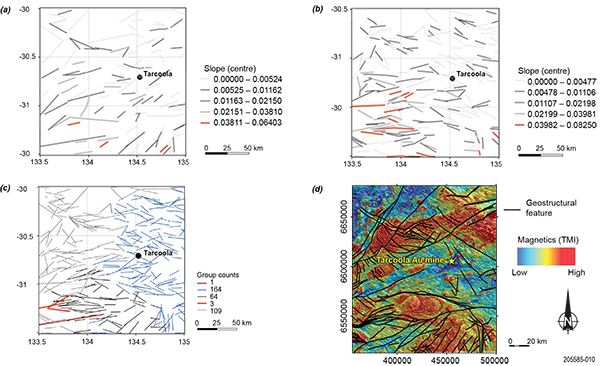
Figure 7 (a) GCAS Region 9A in the vicinity of Tarcoola. (b) Lineaments extracted from gravity data and TMI RTP (total magnetic intensity reduced to pole) grouped by topographic gradient across segment centres, respectively. (c) Grouping analysis performed on the collage of the lineaments shown in (a) and (b). (d) Mesoproterozoic fault set (solid geology; from Pawley and Wilson 2019) with the TMI dataset in the background (sourced from SARIG 2020a).
To compare manually interpreted lineaments with computer-assisted lineaments for the subsurface and surface, we developed a computer-assisted workflow as presented in Kelka and Martinez (2019). Applying linear analysis to manually identified faults by Pawley and Wilson (2019) supported the computer-identified features. These fault patterns display a natural fault or fracture networks (Manzocchi 2002; Sanderson et al. 2018; Fig 7).
When computer-assisted lineament extraction from basement datasets is compared with the structural interpretation by Pawley and Wilson (2019) using a density map, both lineament populations become discernible (Fig 7). In the density map, red denotes areas of high numbers of extracted basement lineaments (Fig 7). This supports the geological significance of the basement lineaments extracted using the computer-assisted methodology.
Figures 6 and 7 display 3 main areas where high density of lineaments coincides with a high density of mapped geological structures, though many other red domains appear not to be related to the Pawley and Wilson (2019) interpretation. Some areas have a pervasive magnetic signature that likely represents several things: (1) a primary feature related to rock formation, such as interlayered lithologies (e.g. bedding); (2) a feature that was imposed on the rock during metamorphism or deformation; or (3) the structures could separate the high-density areas of basement features. Further study is required to identify if these areas are the result of artefacts of the methodology, or undetected high-density areas of basement features that have not yet been identified. A caveat is that the area with less person-interpreted structure is under deeper cover, therefore, there is less confidence in marking individual faults. However, the computer is analysing gradient changes which can still be visually recognised, but are just not as visibly sharp as those in the less buried regions.
Landscape variability and the fabric of the basement in the central Gawler Craton
One of the most challenging aspects of landscape study is determining the geographic extent of features that can differentiate landscapes into different domains (e.g. Ollier 1978). Field observations have been relied upon to understand landscape diversity at regional scale (González-Álvarez et al. 2016; Albrecht et al. 2021). However, a constraint on this approach is the uncertainty in the extrapolation of individual, small-scale or site-specific field observations, especially when attempting to extrapolate these to regional scales. Such extrapolation suffers due to the complexity and variability of landforms, and the difficulty in defining quantitative criteria that discriminates diverse landscape types from one another. However, there are a wide variety of existing quantitative methods in geomorphology developed for small scales (~10 km). Modern data analytics technology and the advances in satellite imaging provide access to large datasets that can assist in characterising landscape features and their distribution at regional scales (e.g. Wilford et al. 2016; Jasiewicz et al. 2014, 2015; de Caritat et al. 2017; Caruso et al. 2018; Albrecht et al. 2021).
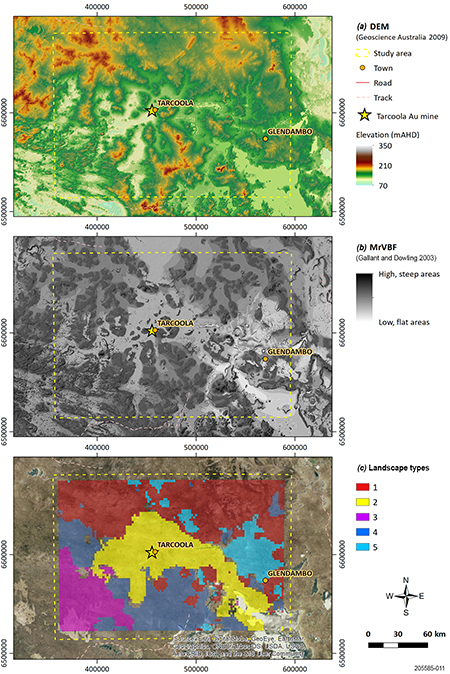
Figure 8 (a) Digital elevation model of the study area (after Geoscience Australia 2009). (b) Flatness map (after Gallant and Dowling 2003). (c) Landscape pattern recognition map (this study).
The display of DEMs can be enhanced for the visualisation of various surface features, gradients, and other variability, by choosing a different spectrum of colours (Fig 8a). In addition, DEM data can be processed by algorithms to highlight specific features within the data, such as the surface expression of valley and paleovalley bottoms, which generates the multiresolution valley bottom flatness (MrVBF) referred here as a ‘flatness’ map (Gallant and Dowling 2003). The MrVBF algorithm visualises the distinction between hillslopes and valley bottoms, essentially separating erosional and depositional areas, which is a fundamental element for sedimentary dynamics assessment of landscapes (Fig 8b). Likewise, the LPR algorithm uses the same DEM data as the flatness map, and groups the landscape into classes based on a domain expert initial visual input from the flatness and/or DEM maps. These land classes are sufficiently uniform within a class, and distinct between classes – not only visually, but also in a mathematical sense. The aggregation methodology preserves those properties and produces clustered data (Fig 8c). One of the advantages of defining landscape variability domains based on surface geometrical features is to avoid human bias. Human observation implies visual definition or characterisation of different components in a landscape. This bias can be amplified by the format employed to visualise data. Therefore, landscape classifications and maps contain a significant component of the author's biases.
Given the landscape context, the LPR results can be interpreted as landscape variability, which is expressed by the dominant identification of a specific surface geometrical pattern. This geometrical variability was explored in this study to test if it could be related to the fabric of the basement rocks at depth, themselves associated with variability in structural orientation, to surface lineaments, and to the location of known mineral deposits.
The LPR domain map indicates that 5 different landscape patterns are present in the central Gawler Craton (Fig 8c). Each of these landscape domains is not characterised by the presence of specific landforms or regolith units, but by the way the different geometrical features (e.g. features associated to individual and groups of landforms) are related to one another.
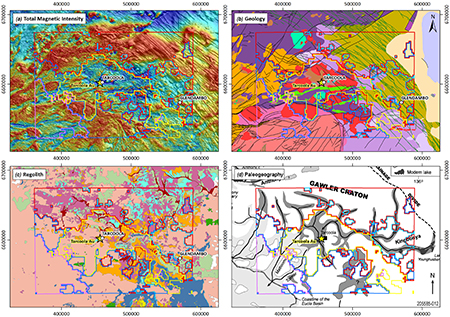
Figure 9 Landscape pattern recognition domain map. (a) Total magnetic intensity (sourced from SARIG 2011). (b) Geology (sourced from SARIG 2020b). (c) Regolith map (after Krapf and Irvine 2016). (d) Paleogeographic reconstruction (after Hou 2004).
We visually compared the LPR domain map with surface and basement lineaments identified manually and using computer-assisted methods as described above. The aim was to assess if the lineament variability was different for any of the 5 different landscape domains that were identified. The results suggest that the lineament fabric of the basement and the surface are independent of the classification applied by the LPR algorithm, and the information they provide is dissimilar (Figs 9a, b). A similar conclusion was drawn when comparing the landscape domain classes with magnetics, basement geology and gravity.
Differences between the LPR domains map and the regional regolith map based on landform-material classification (Krapf and Irvine 2016) are significant (Fig 9c). The dune system in the southwestern area of the regolith map is classified as monotonous and continuous with little variability. It is composed of the same regolith material and landform (Fig 9c). The DEM and the flatness map detect diversity within the dune system (Fig 8). The LPR domain map also displays variability, with up to 4 different landscape domains. Conversely, for the regolith map in the northern portion of study area, the variability of the regolith units mapped is substantial, yet the LPR map displays a single domain. Hence the depth of cover is not correlated with the LPR domain map, nor with the regolith map (Figs 4, 8, 9).
The regolith mapping methodology applied by Krapf and Irvine (2016) has an important influence on landform types and regolith material associated with regolith domains (RTMAP [database], Pain et al. 2007; Pain 2008). Landforms are bounded segments of a land surface that are possibly discontinuous (Evans 2011 and references therein). Individual landforms are separated from their surroundings. In contrast, the LPR domain map detects all geometrical elements of the landscape surface and their spatial relationships, and groups them into landscape pattern domains. In addition, an uncertainty that remains when mapping regolith using landforms is due to DEM density data, and the surface associated with each landform. This results in areas that may not be mapped, or are mapped based on a dominant landform (Evans 2011 and references therein).
The trends and distribution of the LPR domain map has some resemblance to a sedimentary system footprint and evolution of the Kingoonya Paleochannel System (Fig 9d). However, the LPR domain does not perfectly correspond to the outline of the Kingoonya paleochannels. DEMs do not record/display the specific distribution of Cenozoic channels and landforms as they are dominantly under cover/overlain by younger sediments. Still, it records modern geometrical associations, and the ancient relief attributes are linked, which the LPR algorithm could be grouping as domains (e.g. many Cenozoic paleochannels are mirrored in today’s landscape by networks of salt pans and playas; Sheard 2008). Further work on the LPR map-paleographic domain is required, hence, studying the stratigraphy of the cover and sedimentary evolution of each of the mapped landscape domains is crucial to further assess this potential link.
Much work is still pending to fine-tune and better understand how best to apply the LPR algorithm for landscape mapping. However, we are confident that the LPR technology has the potential to delineate physiographic features, and that in combination with other geophysical approaches, it could track the influence of the geomorphological extension of sedimentary systems on the surface/within the modern-day landscape in the central Gawler Craton, as well as in other cover-dominated regions with intense weathering and gentle landscape gradients. We also note that in a milestone report for Geoscience Australia, Pain et al. (2011) classified and summarised the previous work on the physiographic regions in Australia. However, the descriptions in that report were necessarily broadly defined and qualitative. We suggest the LPR algorithm could be a step towards quantifying physiographic regions and be widely applicable across the continent.
Regolith, surface lineaments, landscape, geological structures, deposits and minerals systems: targeting areas of interest to follow up
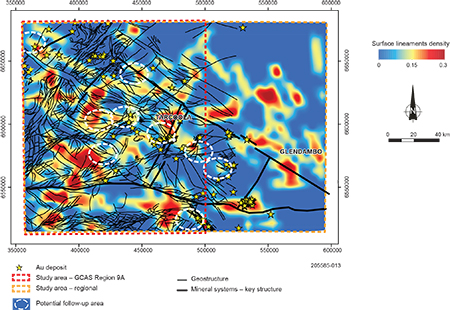
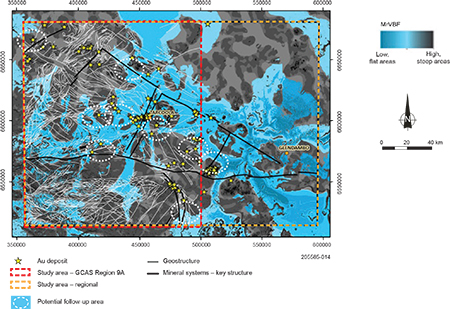
Mineral deposits are generally associated with specific geological structures, the mapping of which is key to identifying the footprint of a mineral system in general, and specifically for the gold deposits in the Gawler Craton (J Gum, personal communication, 2019; Fig 10). Known deposits and prospects are mostly correlated with specific areas of erosional landscape regimes, which are at the edge of the topographic gradients (Fig 11 deposits and prospects). Still, the Gawler Craton geographical variability seems to be associated with specific landscape features or regimes (Figs 10, 11). In addition, the density of surface lineaments in a landscape can be linked to the expression of neotectonic activity and could geochemically link the basement through the cover to the surface.
Based on the above, and integrating the outputs of this research, multiple areas of interest have been identified in the study area within the central Gawler Craton, based on 5 proxies: (1) high surface lineament density; (2) known regional geological structures; (3) presence of key (geological) structures associated with mineral systems; (4) areas with historical discoveries of ore deposits; and (5) areas associated with gradients in erosional landscape regimes (Figs 10, 11).
Figure 10 Potential follow-up areas suggested in this study (white dotted ovals) shown over density surface lineaments (this study), interpreted geological structures (after Pawley and Wilson 2019), gold deposits or prospects (sourced from SARIG 2019) and mineral systems key structures (J Gum, personal communication, 2019).
Figure 11 Potential follow-up areas suggested in this study (white dotted ovals) shown over flatness map image (modified after Gallant and Dowling 2003) with interpreted geological structures (Pawley and Wilson 2019), gold deposits or prospects (sourced from SARIG 2019) and mineral systems key structures (J Gum, personal communication, 2019).
Conclusion
- A new computer-assisted workflow to detect lineaments in diverse datasets (e.g. SRTM DEM, magnetics, gravity) has been developed (Kelka and Martinez 2019; Kelka et al. accepted) and applied to the central Gawler Craton region.
- The resulting lineaments identified using a computer-assisted protocol display consistent natural patterns that can be used to complement manual geological interpretations.
- The manual interpretation supports the computer-derived one, but the computer-derived one extends the manual one to areas where there is less certainty in the linear features evident to the eye – such as under cover.
- The fabric of the basement in the central Gawler Craton is mirrored by or through the cover for surface lineaments identified manually. Some of the major basement structures correspond to the termination of, or gaps between, areas with higher density of surface lineaments.
- The LPR algorithm has mapped 5 different landscape domains in the central Gawler Craton based on geometrical variability of surface features detected in the DEM.
- The LPR domain map most closely resembles the different environments of the sedimentary system footprint of the Kingoonya Paleochannel System. This suggests the LPR algorithm may have the potential to map, or be further developed to map, physio(geo)graphic units.
- Eight follow-up areas for future analysis and follow-up surface sampling have been identified in the central Gawler Craton, based on the convergence of 5 proxies: (1) surface lineament density areas; (2) regional geological structures; (3) key structures associated with mineral systems; (4) areas with historical discoveries of mineral deposits; and (5) areas related to gradients in erosional landscape regimes.
Acknowledgements
We would like to acknowledge the traditional owners of the land of which this research has been conducted, the Antakirinja Matu-Yankunytjatjara and the Kokatha people and their past, present and future elders. The Geological Survey of South Australia and the Department for Energy and Mining are thanked for their support. We would like to especially thank Rohan Cobcroft, Laz Katona and Marc Twining for their support throughout the project. Tim Prokopiuk is thanked for his comments. This project received funding from the Geological Survey of South Australia and CSIRO. Reviewers Anthony Reid and Ian Lau are thanked for their critical comments and suggestions that have greatly improved on this article.
References
AMIRA 2017. Unlocking Australia’s hidden mineral potential – Stage 1: The roadmap, Fact Sheet. Geoscience Australia, Canberra.
Anand RR and Butt CRM 2010. A guide for mineral exploration through the regolith in the Yilgarn Craton, Western Australia. Australian Journal of Earth Sciences 57:1015–1114. doi:10.1080/08120099.2010.522823.
Baudet E, Tiddy C, Giles D, Gordon G and Hill S 2020. Diverse provenance of the Lower Cretaceous sediments of the Eromanga Basin, South Australia: constraints on basin evolution. Australian Journal of Earth Sciences 68(3):316–342. doi:10.1080/08120099.2020.1772367.
Budd AR and Skirrow RG 2007. The nature and origin of gold deposits of the Tarcoola goldfield and implications for the Central Gawler Gold Province, South Australia. Economic Geology 102(8):1541–1563. doi:10.2113/gsecongeo.102.8.1541.
Clark D 2010. Identification of Quaternary scarps in southwest and central west Western Australia using DEM-based hill shading: application to seismic hazard assessment and neotectonics. International Journal of Remote Sensing 31(23):6297–6325. doi:10.1080/01431161003631592.
Clark D, McPherson A and Collins CDN 2011. Australia's seismogenic neotectonic record: a case for heterogeneous intraplate deformation, Record 2011/11. Geoscience Australia, Canberra.
Clark D, McPherson A and Van Dissen R 2012. Long-term behaviour of Australian stable continental region (SCR) faults. Tectonophysics 566–567, 1–30. doi:10.1016/j.tecto.2012.07.004.
Daly SJ, Fanning CM and Fairclough M 1998. Tectonic evolution and exploration potential of the Gawler Craton, South Australia. AGSO Journal of Australian Geology & Geophysics 17(3):145–168.
Daly SJ, Horn CM and Fradd WP 1990. Tarcoola goldfield. In Hughes FE ed, Geology of the mineral deposits of Australia and Papua New Guinea, Monograph 14. Australasian Institute of Mining and Metallurgy, pp 1049–1053.
Elmahdy SI and Mohamed MM 2014. Relationship between geological structures and groundwater flow and groundwater salinity in Al Jaaw Plain, United Arab Emirates: mapping and analysis by means of remote sensing and GIS. Arab Journal of Geosciences 7:1249–1259. doi:10.1007/s12517-013-0895-4.
Elmahdy SI, Shattri M, Bujang BKH, Ahmed RM and Sharharin I 2012. Application of terrain analysis to the mapping and spatial pattern analysis of subsurface geological fractures of Kuala Lumpur limestone bedrock, Malaysia. International Journal of Remote Sensing 33(10):3176–3196. doi:10.1080/01431161.2011.634860.
Evans IS 2011. Geomorphometry and landform mapping: what is a landform? Geomorphology 137(1):94–106. doi:10.1016/j.geomorph.2010.09.029.
Ferris GM, Schwarz MP and Heithersay P 2002. The geological framework, distribution and controls of Fe-oxide and related alteration, and Cu-Au mineralisation in the Gawler Craton, South Australia. Part I – Geological and tectonic framework. In Porter TM ed, Hydrothermal iron oxide copper-gold and related deposits: a global perspective. PGC Publishing, Adelaide, pp 9–31.
Fraser GL, McAvaney S, Neumann NL, Szpunar M and Reid A 2010. Discovery of early Mesoarchean crust in the eastern Gawler Craton, South Australia. Precambrian Research 179:1–21. doi:10.1016/j.precamres.2010.02.008.
González-Álvarez I, Goncalves M and Carranza J 2020a. Introduction to the Special Issue, Challenges for mineral exploration in the 21st century: targeting mineral deposits undercover. Ore Geology Reviews 126:103785. doi:10.1016/j.oregeorev.2020.103785.
González-Álvarez I, Krapf C, Fox D, Ibrahimi T, Foss C, Dutch R, Jagodzinski L, Legras M, Pinchand T, Noble RRP and Reid N accepted. Maximizing drilling information in greenfields exploration: linking the fabric and geochemical footprint of the basement to the surface in South Australia. Journal of Geochemical Exploration.
González-Álvarez I, Lau IC, Metelka V, Rondón-González O, Wells MA, Danišík M, Ibrahimi T and LeGras M 2020c. Gold exploration in Forrestania: Western Australia, Report EP202644. CSIRO, Australia.
González-Álvarez I, Salama W and Anand RR 2016. Sea-level changes and buried islands in a complex coastal palaeolandscape in the south of Western Australia: implications for greenfield mineral exploration. Ore Geology Reviews 73(3):475–499. doi:10.1016/j.oregeorev.2015.10.002.
Hand M, Reid AJ and Jagodzinski EA 2007. Tectonic framework and evolution of the Gawler Craton, South Australia. Economic Geology 102(8):1377–1395. doi:10.2113/gsecongeo.102.8.1377.
Hein KAA, Both RA and Bone Y 1994. The geology and genesis of the Tarcoola gold deposits, South Australia. Mineralium Deposita 29:224–236. doi:10.1007/BF00206865.
Hou B, Frakes LA, Alley NF and Clarke JDA 2003b. Characteristics and evolution of the Tertiary palaeovalleys in the northwest Gawler Craton, South Australia. Australian Journal of Earth Sciences 50(2):215–230. doi:10.1046/j.1440-0952.2003.00987.x.
Hou B, Frakes LA, Sandiford M, Worrall L, Keeling J and Alley NF 2008. Cenozoic Eucla Basin and associated palaeovalleys, southern Australia — climatic and tectonic influences on landscape evolution, sedimentation and heavy mineral accumulation. Sedimentary Geology 203(1–2):112–130. doi:10.1016/j.sedgeo.2007.11.005.
Hughes FJ 1998. Perseverance gold deposit, Tarcoola. In Berkman DA and Mackenzie DH eds, Geology of Australian and Papua New Guinean mineral deposits, Monograph 22. Australasian Institute of Mining and Metallurgy, pp 395–399.
Jasiewicz J, Netzel P and Stepinski TS 2014. Landscape similarity, retrieval, and machine mapping of physiographic units. Geomorphology 221(15):104–112. doi:10.1016/j.geomorph.2014.06.011.
Jasiewicz J, Netzel P and Stepinski TS 2015. GeoPAT: a toolbox for pattern-based information retrieval from large geospatial databases. Computer and Geosciences 80:62–73. doi:10.1016/j.cageo.2015.04.002.
Kelka U, Martinez C, Westerlund S, Krapf C, González-Álvarez I, Foss C and Pawley M accepted. Establishing an integrated workflow linking surface and subsurface lineaments for mineral exploration under cover: example from the Gawler Craton, South Australia. Copernicus Solid Earth Journal.
Klump J, Albrecht T, González-Álvarez I, Smith CG and Pernreiter S 2018. Using machine learning to classify landforms for minerals exploration. AGU Fall Meeting 2018, December, USA. American Geophysical Union, pp T31E-0371.
Koch M and Mather PM 1997. Lineament mapping for groundwater resource assessment: a comparison of digital synthetic aperture radar (SAR) imagery and stereoscopic large format camera (LFC) photographs in the Red Sea Hills, Sudan. International Journal of Remote Sensing 18(7):1465-1482. doi:10.1080/014311697218223.
Kositcin N 2010. Geodynamic synthesis of the Gawler Craton and Curnamona Province, Record 2010/027. Geoscience Australia, Canberra.
Lewis SJ, Hanna AL, Kilgour PL, Bastrakov EN, Wischusen JDH and von Behrens M 2013. Hydrogeology and hydrogeochemistry of the Kingoonya Palaeovalley, South Australia: final technical report of the Palaeovalley Groundwater Project for the Gawler–Eucla demonstration site, Record 2012/05. Geoscience Australia, Canberra.
Morris PA, de Souza Kovacs N and Scheib AJ 2018. Regolith chemistry of the Ngururrpa area, northeastern Western Australia, Record 2018/3. Geological Survey of Western Australia.
Ollier CD 1978. Terrain classification: methods, applications and principles. In Hails JR ed, Applied geomorphology: a perspective of the contribution of geomorphology to interdisciplinary studies and environmental management, Elsevier, Amsterdam, ch 8.
Pain C, Gregory L, Wilson P and McKenzie N 2011. The physiographic regions of Australia, Explanatory notes. Australian Collaborative Land Evaluation Program and National Committee on Soil and Terrain.
Porwal A, González-Álvarez I, Markwitz V, McCuaig TC and Mamuse A 2010. Weights-of-evidence and logistic regression modeling of magmatic nickel sulfide prospectivity in the Yilgarn Craton, Western Australia. Ore Geology Reviews 38(3):184–196. doi:10.1016/j.oregeorev.2010.04.002.
Preiss WV 2019. The tectonic history of Adelaide’s scarp-forming faults. Australian Journal of Earth Sciences 66(3):305–365. doi:10.1080/08120099.2018.1546228.
Quigley MC, Clark D and Sandiford M 2010. Tectonic geomorphology of Australia. In Bishop P and Pillans B eds, Australian Landscapes, Special Publications 346. The Geological Society of London, pp 243–265. doi:10.1144/SP346.13.
Reid AJ, Jagodzinski EA, Fraser GL and Pawley MJ 2014. SHRIMP U–Pb zircon age constraints on the tectonics of the Neoarchean to early Paleoproterozoic transition within the Mulgathing Complex, Gawler Craton, South Australia. Precambrian Research 250:27–49. doi:10.1016/j.precamres.2014.05.013.
Sahoo PK, Kumar S and Singh RP 2000. Neotectonic studies of Ganga and Yamuna tear faults, NW Himalaya using remote sensing and GIS. International Journal of Remote Sensing 21(3):499–518. doi:10.1080/014311600210713.
Sanderson DJ, Peacock DC, Nixon CW and Rotevatn A 2018. Graph theory and the analysis of fracture networks. Journal of Structural Geology 125:155–165. doi:10.1016/j.jsg.2018.04.011.
Sandiford M 2003. Neotectonics of southeastern Australia: linking the Quaternary faulting record with seismicity and in situ stress. In Hillis RR and Muller D eds, Evolution and dynamics of the Australian Plate. Geological Society of America, pp 101–113. doi:10.1130/0-8137-2372-8.107.
Sandiford M 2007. The tilting continent: a new constraint on the dynamic topographic field from Australia. Earth Planetary Science Letters 261(1–2):152–163. doi:10.1016/j.epsl.2007.06.023.
Sandiford M and Quigley MC 2009. TOPO–OZ: insights into the various modes of intraplate deformation in the Australian continent. Tectonophysics 474(1–2):405–416. doi:10.1016/j.tecto.2009.01.028.
Sandiford M, Quigley M, de Broekert P and Jakica S 2009. Tectonic framework for the Cenozoic cratonic basins of Australia. Australian Journal of Earth Sciences 56: 5–18. doi:10.1080/08120090902870764.
Skirrow RG, Bastrakov EN, Barovich KM, Fraser GL, Creaser RA, Fanning CM, Raymond OL and Davidson GJ 2007. Timing of iron oxide Cu-Au-(U) hydrothermal activity and Nd isotope constraints on metal sources in the Gawler Craton, South Australia. Economic Geology 102(8):1441–1470. doi:10.2113/gsecongeo.102.8.1441.
Solomon M and Groves DI 2000. The geology and origin of Australia’s mineral deposits, Publication 12. Reprint with additional material. Centre for Ore Deposit Research and Centre for Global Metallogeny.
Swain GM, Hand M, Teasdale J, Rutherford L and Clark C 2005. Age constraints on terrane-scale shear zones in the Gawler Craton, southern Australia. Precambrian Research 139(3–4):164–180. doi:10.1016/j.precamres.2005.06.007.
Tiddy CJ, Hill SM, Giles D, van der Hoek BG, Normington VJ, Anand RR, Baudet E, Custance K, Hill R, Johnson A, McLennan S, Mitchell C, Zivak D, Salama W, Stoate K and Wolff K 2019. Utilising geochemical data for the identification and characterisation of mineral exploration sample media within cover sequence materials. Australian Journal of Earth Sciences. doi:10.1080/08120099.2019.1673484.
Tiren S 2010. Lineament interpretation short review and methodology, report 2010:33. GEOSIGM.
Wilford JR, Searle R, Thomas M, Pagendam D and Grundy MJ 2016. A regolith depth map of the Australian continent. Geoderma 266:1–13. doi:10.1016/j.geoderma.2015.11.033.


