Ryan Noble1, Ignacio González-Álvarez1, Nathan Reid1, Carmen Krapf2, G Tenten Pinchand1, David Fox1, Tania Ibrahimi1, Dave Cole1 and Ian Lau1
1 CSIRO
2 Geological Survey of South Australia, Department for Energy and Mining
Download this article as a PDF (5.8 MB); cite as MESA Journal 89, pages 4–14
Published February 2019
Introduction
The Coompana Province in far western South Australia is an under-explored region undergoing renewed mineral exploration interest. The area is characterised by a magnetic anomaly and a substantial sedimentary cover creating a need for innovative approaches to geochemical exploration. The integration of geochemical exploration methods with other data such as geophysics, digital elevation models and spectral sensing maps can be developed for these terrains. This initiative is providing a template that can be transferred to other regions in future exploration initiatives. The PACE Copper initiative aimed to fast-track exploration, discovery and information in South Australia, with a focus on new research, technical innovations and contemporary datasets. One component was specifically designed to provide world-class data and analysis for the untouched minerals province in the state's Far West. The recently completed joint project between CSIRO and the Geological Survey of South Australia (GSSA) aligns with that objective (Department of the Premier and Cabinet 2017). The project was completed in August 2018 with the final report and data released in November 2018 (Noble et al. 2018). The project also builds the crossover links between near surface and deeper geological research, aligning strongly with the UNCOVER major research initiative.
The GSSA–CSIRO collaboration aimed to understand the geological setting creating the magnetic anomaly as well as the depth of cover over this feature (Foss et al. 2017). A first-pass study by Dunn and Waldron (2014 a, b) indicated vegetation chemistry at the surface may provide an indication of deep geophysical or geological boundaries and assist in greenfield exploration targeting.
Our objective was to identify geochemical trends in the surface and assess if there were any large geochemical haloes arising from changes in lithology at depth as suggested by the magnetic anomaly and commonly present over buried mineralised districts. Developing a protocol for quick and efficient sampling, and with minimal environmental impact, was crucial to this study. This article provides an overview of the main outcomes of the project and is a summary of the results provided in Noble et al. (2018).
Setting
The landscape of the Coompana region is comprised of the large-scale Nullarbor Plain (Figs 1, 2a). The plain is the surface expression of the Miocene (c. 23–5 Ma) Nullarbor Limestone deposited on a vast subtropical epeiric sea platform. It represents one of the largest limestone outcrops on earth (>300,000 km2; O’Connell, James and Bone 2012). The Nullarbor Plain has minimal topographic variation (Fig. 2a) and currently experiences semi-arid climatic conditions (annual precipitation ~150–400 mm and evaporation of ~2,000–3,000 mm; Bureau of Meteorology 2013). Although the Coompana region appears extremely flat, topography revealed a slight decrease in elevation occurring from the northwest to the southeast (~100 m over ~80 x 50 km, Figs 2b, c).
The stratigraphic sequence in the region displays three sedimentary packages: the Permian Denman Basin (c. 360–255 Ma), Jurassic–Cretaceous Bight Basin (c. 200–66 Ma) and Cenozoic Eucla Basin (<66 Ma). These sedimentary packages were deposited upon basement rocks characterised by gneisses, granodiorites, basalts and granites (Dutch et al. 2017).
Figure 2 Local landscape framework for the Coompana area. (a) Surface geology at a regional scale, including the Coompana study area where surface samples were collected. (b) Shaded topography based on 3-second SRTM DEM (Shuttle Radar Topography Mission digital elevation model) data. (c) Flatness map displaying slope gradient trends. The location of historical drillholes BN 1, BN 2 and CD1, as well as the new drillhole CDP008 are shown. These drillholes intersected the sedimentary cover and were used in this study to characterise the geochemistry of the different stratigraphic units in the cover.
Methods
Two separate, but linked activities were done in this project to achieve the objectives: 1) to rapidly characterise the surface geochemistry as a baseline for future activities, and 2) to assess the likelihood of a surface geochemical signature being traced to depth.
Rapid characterisation
Figure 3 Coompana sample sites (4 km spacing) excluding infill samples over total magnetic intensity image highlighting the overlap with the large, subsurface Coompana magnetic anomaly.
The project completed grid sampling at 4 km intervals (~280 sites) over a region of 4,000 km2 using a helicopter (Fig. 3). Field sampling times were 5–6 minutes per site in a 3-person team to collect 5 sample media, and analytical preparation and processing time of 4 minutes per sample in a 3-person team. This rapid collection was achieved through integration of tablets and mobile server for rapid data acquisition using the FAIMS (Field Acquired Information Management System) android application that is further detailed in Noble et al. (2018).
At each site, 300–600 g of soil was collected from a shallow hole of 5–10 cm depth using a clean plastic trowel and placed in a geochemical sample paper bag (125 x 250 mm). Most samples were collected ~5–10 cm above the rock interface, although occasionally a deeper profile occurred (30–40 cm). Sample sites were selected based on being representative of the area and commonly away from outcropping rocks or extensive clay pans that represent shallow low-lying areas and possibly have a greater contribution of alluvial materials.
Other media collected and analysed at each site included a soil crust/cryptogam sample, lithic lag sample and the two dominant plant species – pearl blue bush (Maireana sedifolia) and salt bush (Atriplex vesicaria). These results are not discussed in this paper, but are available in Noble et al. (2018).
To achieve rapid characterisation, a field portable sample preparation laboratory (crush, mill and pellet press) was set up and coupled with optimised pXRF (portable X-ray fluorescence) and ASD (analytical spectral device) analysis (Fig. 4). All soil samples collected were analysed within 24 hours. Basic requirements for the laboratory were protection from weather, power and bench space/tables. Samples were split with a bulk reference sample retained. The split was crushed using the Reflex™ mobile crusher and milled to <100 µm using the Reflex™ mobile disk mill. Approximately 25 g of the milled soil was pressed into a pellet using a Reflex™ press to provide a smooth, uniform surface for analysis with the pXRF and ASD. Silica blanks were analysed approximately every 40 samples to monitor external contamination. Duplicate sample analyses were made approximately every 40 samples to assess instrument precision and detection limits. Data calibration of pXRF measurements against known standard compositions was performed using CSIRO software that employs additive log-ratio transformation of data to account for compositional system closure, and a Bayesian linear regression algorithm to robustly estimate and propagate uncertainties. An Olympus Vanta M-series pXRF (50 kV X-ray tube and fitted with a large area silicon drift detector) was used in a stand operating for a total of 60 seconds (30 seconds for each of two beams of different energy levels). All samples and standards were covered by a 4 µm polypropylene film. The ASD (Field Spec 3) with a high intensity contact probe was setup in the field for visible-near to shortwave infrared reflectance measurements of the pressed pellets. A piece of Spectralon was used as the white reference. Each measurement consisted of an average of 30 scans. Processing of the data consisted of correcting the spectra to absolute reflectance by applying the Spectralon calibration reflectance factor using The Spectral Geologist (TSG). Automated feature extraction was performed to estimate the proportions of minerals using TSG.
Figure 4 The portable laboratory at Coompana. From left to right: riffle splitter, crusher and mill on one table, pellet press on the old desk, and pXRF and ASD (inside cardboard box, far right) on the other table. (Photo 417743)
Depth profile
Drillhole CDP008 was sampled and characterised to assess genesis and geochemical dispersion. The drillhole is located ~105 km ENE of Border Village and ~15 km NE of Koonalda Homestead (Figs 2 and 3; Dutch et al. 2017) and just outside the area used for the surface study.
Throughout ~650 m of core from CDP008, 46 samples were collected for whole-rock geochemistry: 9 samples from basement and 37 from the overlying sedimentary sequence. No drilling samples were collected between ~20 and 180 m depth due to presence of a karstic system and the risk of losing drilling rods. Samples were pulverised with mild-steel mills and analysed for major and trace element whole-rock compositions (69 elements) by Bureau Veritas Australia Pty Ltd (Canning Vale, Western Australia). Analytical codes for detailed descriptions of analytical protocols are (Bureau Veritas 2018): XF103 (major elements), LA100 (fused bead LA-ICP-MS, laser ablation inductively coupled plasma - mass spectrometry) and LA101 (elements determined by LA-ICP-MS for rare earth elements (REE) and high field strength elements (HFSE); FA003 (Au, Pt and Pd; lead collection fire assay – ICP-MS); GC007 (F) and TC003 (S and C). After every 20 samples a blank was analysed along with 3 duplicates. In addition, internal standards were analysed: BCS 381 Basic Slag, UT Fe Ore 1, Gannet ST-576, NCS DC 35006 Copper Con, OREAS 72a nickel sulfide ore, SARM 3 NIM-L Lujavrite and OREAS 45e. Geochemical analysis and spider plots have been normalised to upper continental crust average values from Rudnick and Gao (2003).
A selected subset of 17 samples was prepared for XRD (X-ray diffraction) analysis to identify the mineralogical composition using a Bruker D4 Endeavor AXS instrument operating with Co radiation at CSIRO Australian Resources Research Centre laboratories, Kensington, Western Australia. The data collection range of 2θ angle was from 5 to 90°, with an increment of 0.02°, divergence slit of 1°, and a data collection time of 7 minutes per sample. The obtained XRD patterns were processed using the Bruker DIFFRAC.EVA software package.
Results
Rapid characterisation
In only 7 days the project team collected, analysed and conducted targeted infill sampling to generate regional geochemical and proxy-mineralogical maps of soil and rock over an area of nearly 4,000 km2. The infill sampling was conducted at 1 km spacing (36 sites) on the final sampling day, based on the results of the regional geochemistry maps being produced in nearly real-time as a demonstration of using a portable laboratory to focus exploration without the need for later remobilisation (second sampling trip).
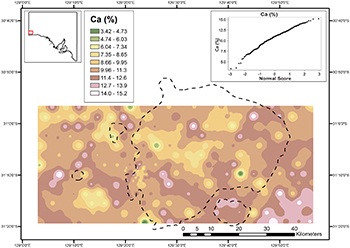
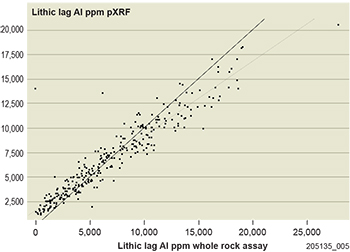
A negative correlation was present between Al and Ca in the Coompana soils. The increase in the Ca in the soil towards the southeast of Coompana (Fig. 5) was identified in the field and then assessed to relate to a shift in vegetation (some trees) and an increase in some pedogenic carbonate. Overall, most of the Ca measured in the field by pXRF was between 8 and 14% (Fig. 5). Results show the pXRF data trends in Ca, Al, Fe, K and Si are very consistent with the commercial laboratory data, and there was no benefit to add this further major element analysis (Table 1, Fig. 6).
Figure 5 Calcium in shallow soils measured using pXRF for the Coompana region. Data is contoured using inverse weighted distances and coloured by equal intervals. The dashed line shows the magnetic anomaly at Coompana.
Table 1 Geochemical comparison between major elements determined by pXRF (field) and 4-acid, alkaline fusion ICP-MS/ICP-OES (laboratory)
| Element | Result comparison: pXRF vs 4-acid, alkaline fusion ICP-MS/ICP-OES |
|---|---|
| Al | Same results for spatial patterns and similar concentration range. |
| Ca | Same results for spatial patterns and similar concentration range. |
| Fe | Same results for spatial patterns and similar concentration range. |
| K | Same results for spatial patterns, concentrations near detection limit in pXRF resulting in less information and plot not as smooth. |
| Mg | pXRF not effective as Mg was too low for the lighter element analysis. |
| Mn | Similar results for the pXRF and %MnO, but not as good as the Mn ppm ICP-MS. pXRF was 4 x detection limit so the resolution not as good, but did pick the anomalous high value. |
| S | Similar results. pXRF picks the trends, but low concentrations not as smooth as the ICP-OES. |
| Si | Same results for spatial patterns and similar concentration range. |
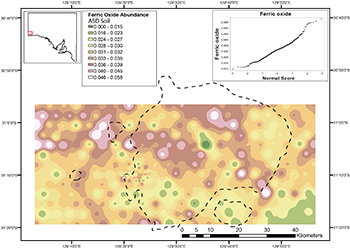
Field ASD results showed trends that correspond to ferric oxide abundance being greater towards the northern extent of the surveyed area (Fig. 7). This is similar to the kaolinite index and in contrast to the hematite:goethite ratio maps generated in the field. The Coompana soils were all geochemically similar to each other and the reflective properties and element concentrations demonstrate a subtle variation that is easily overlooked when interpreting other results such as pathfinder elements for exploration.
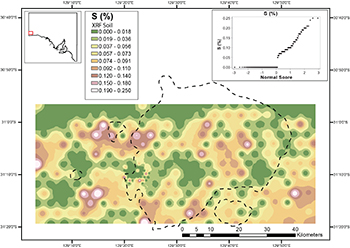
A preliminary study by Dunn and Waldron (2014) indicated S was possibly elevated in a few selected samples of vegetation above the magnetic anomaly and, for this reason, S was investigated further. Sulfur was low in these soils and more than half of the samples were below detection limits (Fig. 8). A few greater S concentrations are present in small clusters or points, but none relate to anything else observed at Coompana. Less S is present in the Coompana soils in the furthest northern extent of the study region (Fig. 8).
Trace metals of interest, such as Cu and Au, were below the detection limit capabilities of the pXRF. Copper was below 30 ppm in the field, which was corroborated by later laboratory analysis (see Noble et al. 2018) revealing Cu concentrations between 1 and 35 ppm. It is likely that the field approach would have been more successful in a region with more Cu (estimated mean continental upper crust Cu levels are 25 ppm; Wedepohl 1995), but this remains to be tested.
Copper, Au and other elements of exploration interest were also analysed using more traditional laboratory based methods including alkaline fusion ICP-MS and ICP-OES (optical emission spectroscopy). These results and those of the other sample media (lag and vegetation) are available in Noble et al. (2018) and via SARIG, the South Australian Resources Information Gateway.
Figure 7 Ferric oxide abundance using the 900 nm absorption feature in shallow soils measured using ASD for the Coompana region. Data is contoured using inverse weighted distances and coloured by natural breaks. The dashed line shows the magnetic anomaly at Coompana.
Depth profile
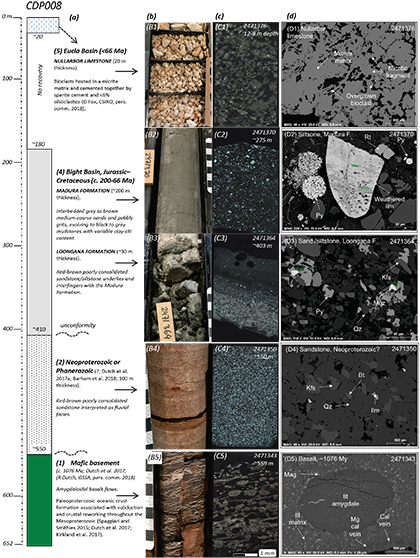
Figure 9 Summary information for CDP008 drill core. (a) Stratigraphy and interpreted sedimentary environments. (b–c) Core and chip tray images of representative samples of the stratigraphic units sampled for geochemistry, (C1) packstone, (C2), (C3) and (C4) subarkose sandstones, (C5) altered basalt. (d) Representative petrographic microphotographs of the different stratigraphic units.
CDP008 intersected volcanic mafic basement rocks at a depth of ~550 m. These basalts are overlain by undifferentiated fluvial sediments (Fig. 9a; ~110 m thickness in CDP008), which are themselves overlain by Jurassic to Cretaceous sediments that are interpreted to have been deposited under low-sinuosity fluvial conditions within isolated grabens of a developing rift valley (Dutch et al. 2017). These evolved vertically into marine and low-energy lacustrine deposits of the Loongana and Madura formations (Hill 1995; Fig. 9a; ~240 m thickness in CDP008). The Eucla Basin sedimentary package overlies the Bight Basin sedimentary package to the modern landscape surface. CDP008 sampled the uppermost Nullarbor Limestone, which is interpreted as the result of deposition on a shallow marine platform with low siliciclastic input, from 20 to 10 Ma (James and Bone 1991; Fig. 9a; ~20 m thickness in CDP008).
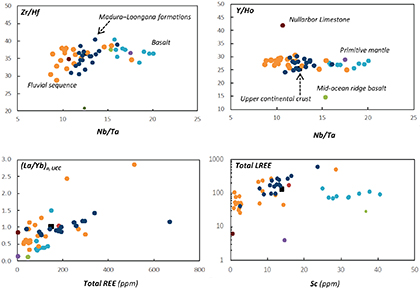
Analyses of REE from CDP008 samples of the basalts, lower sandstone unit, Bight Basin sedimentary package and Nullarbor Limestone are summarised in Table 2 and Figure 10. Total REE as well as some individual REE display some variation between the four sample groups. REE patterns in the basalts and the overlying sandstone package show similarities and are interpreted as the result of basement reworking during the sandstone unit deposition and/or post-depositional vertical and lateral geochemical dispersion processes. However, the Bight Basin sedimentary units do not display any specific geochemical similarity with the lower stratigraphic units. Zr/Hf and Y/Ho ratio low variability and similarity to upper continental crust values throughout the stratigraphic sequence indicate that Zr, Hf, Y and Ho were not affected by any post-depositional processes, which would have fractionated them. Authigenic goethite and pyrite are widespread throughout the stratigraphic sequence.
The sedimentary sequence of the Bight Basin contains abundant K-feldspar with a glauconitic-rich matrix, with kaolinite present as a minor component. This is consistent with low chemical weathering intensity in the catchment area and a depositional environment in a restricted and shallow marine setting (Fig. 9).
Table 2 Summary of REE mean values in CDP008 in the different geological units compared to the upper continental crust
| Element | Upper continental crust | Basalt | Sandstone | Bight Basin units | Nullarbor Limestone |
|---|---|---|---|---|---|
| Total REE (ppm) | ~150 | ~105 | ~120 | ~220 | ~10 |
| (La/Yb)n, ucc | 1.0 | 0.5 | 0.9 | 1.0 | 0.8 |
| Light REE/heavy REE | ~22 | ~10 | ~20 | ~25 | ~15 |
| Eu/Eu* | 1.0 | 1.3 | 1.0 | 0.9 | 1.1 |
| Zr/Hf | ~35 | ~37 | ~36 | ~35 | ~35 |
| Y/Ho | 25 | ~27 | ~28 | ~27 | ~40 |
Figure 10 Geochemical ratios. Different elemental ratios are employed to describe main HFSE and REE fractionations and fingerprint the different stratigraphic units identified in drillhole CDP008.
Geochemical dispersion through the thick (500 m) cover was investigated in drillhole CDP008 and evidence of geochemical dispersion processes at depth were found. The geochemical footprint of the basement is present in the overlaying sandstone sequence. This may be related to both the physical erosion and recycling of the basaltic units in the basement during the deposition of the sandstones and the vertical hydromorphic dispersion, allowing diffusion throughout the porous sandstone, during geological times. In shallower samples, the Loongana Formation displays flat REE, HFSE and transition metal patterns plotting variable close to upper continental crust values, whereas the Madura Formation displays REE and HFSE that are more variable with erratic transition metal patterns. This is understood to be the result of a wide variety of sediment sources and a homogenisation of the sedimentary budget for the former, and a more local and specific source that preserved its geochemical variability for the latter. Therefore, any vertical geochemical dispersion through these two formations would be difficult to identify. Finally, the uppermost stratigraphic units at Coompana are the Eucla Basin limestones (~200 m); the top Nullarbor Limestone comprises ~95 wt% carbonate; this lithological unit and its rheological properties represent a restriction for the development of vertical geochemical dispersion, which limits the possibility of geochemical footprints reaching the modern landscape surface as was observed in the surface geochemistry. Further analysis of the formation/genesis of the sediments is reported in more detail in Noble et al. (2018).
Summary
The project results were intended to identify geochemical trends and detect large geochemical haloes arising from changes in major lithology as indicated in the magnetics and potentially buried mineralised districts, however, this was not the case. Instead, the results highlighted the Coompana region is exceptionally uniform in its surface geochemistry and no clear link to underlying magnetic changes or structures could be detected. The profile study also supported the surface results and showed geochemical dispersion at depth, but significant physical and chemical sedimentary barriers in the upper sequences. Karstic pipelines in the limestones are not efficient dispersion conduits for geochemical dispersion processes due to the low residence time of the fluids that pass through them. However, limestones are exceptional redox buffers due to their carbonate composition. If circulation of alkaline or oxidising fluids transporting metals through the sedimentary package along permeable conduits in the basin could intersect the limestone, this could result in a redox gradient, and therefore this siliciclastic–limestone lithological boundary may represent an excellent media for geochemical sampling. In general, the upper sedimentary package does not exhibit extensive vertical geochemical dispersion, although potential of neotectonics could generate local vertical migration patterns and warrants further investigation (Krapf and González-Álvarez 2017).
As a demonstration of greenfield regional exploration, the Coompana study showed that quick and efficient sampling and field analyses could be successfully achieved with minimal environmental impact. To generate new targets using standard regional surface geochemistry three key activities commonly take place. Firstly, uniform sampling over a broad area, secondly, analyses of samples to establish geochemical background, and finally identify areas of interest for further investigation. This process commonly takes months and is widely practiced. However, huge efficiencies can be achieved with some straightforward technologies such as tablets and apps for rapid data gathering and transfer coupled with a portable preparation and analysis laboratory using pXRF and ASD to make nearly real-time geochemical and mineralogical maps.
The reliability and reproducibility of pXRF data was of excellent quality and comparable to laboratory instruments for major elements. Using the ASD was an effective way to monitor for abnormal samples through soil colour, among other features. Presently, the geoscience community does not effectively merge the spectral mineralogy with the elemental chemistry for interpretation, but it is likely that this will become much more used and manageable in the future, and the reason it was incorporated into this work flow in the field and tested with a machine learning model (see Noble et al. 2018). Future projects will adapt this workflow further to provide other portable instruments and data in the field.
Acknowledgements
We acknowledge the Mirning People, and the members of the Far West Coast Aboriginal Corporation, who are the traditional owners of this land. In particular, Mr Clem Lawrie and Mr Anton Mundy are thanked for undertaking on-country site inspections, helping with the sampling and providing many insights into the landscape and environment we were working in.
We would also like to thank Chris Wilcox, Anna Petts, Rian Dutch, Amy Lockheed, Liz Jagodzinski, Lyn Broadbridge and Ian Hopton from GSSA for their support, as well as Felicity Brant, Jess Robertson, Alistair White, Monica LeGras and Jens Klump from CSIRO, and Brian Ballsun-Stanton from Macquarie University for their help in the field and with the soil sampling labelling. James Cleverly and Des Pascoe from Imdex provided soil sample preparation gear. Aerotech Aviation assisted in soil sampling.
References
Barham M, Reynolds S, Kirkland CL, O'Leary MJ, Evans NJ, Allen HJ, Haines PW, Hocking RM and McDonald BJ 2018. Sediment routing and basin evolution in Proterozoic to Mesozoic east Gondwana: A case study from southern Australia. Gondwana Research 58:122–140.
Bureau of Meteorology 2013. Australian annual average precipitation map, Bureau of Meteorology.
Bureau Veritas 2018. Mineral Laboratories & Services, Bureau Veritas, viewed May 2018.
Department of the Premier and Cabinet 2017. PACE Copper, Department of the Premier and Cabinet, viewed 3 March 2017.
Gallant JC and Dowling TI 2003. A multi-resolution index of valley bottom flatness for mapping depositional areas. Water Resources Research 39, 1347, 4-1/4-13.
James NP and Bone Y 1991. Origin of a cool-water, Oligo-Miocene deep shelf limestone, Eucla Platform, southern Australia. Sedimentology 38:323–341.
Kirkland C, Smithies R, Spaggiari C, Wingate M, de Gromard RQ, Clark C, Gardiner N and Belousova E 2017. Proterozoic crustal evolution of the Eucla basement, Australia: implications for destruction of oceanic crust during emergence of Nuna. Lithos 278:427–444.
O'Connell LG, James NP and Bone Y 2012. The Miocene Nullarbor Limestone, southern Australia; deposition on a vast subtropical epeiric platform. Sedimentary Geology 253–254:1–16.
Rudnick RL and Gao S 2003. The composition of the continental crust. In RL Rudnick ed., The crust. Elsevier, Oxford/New York, pp. 1–64.
Spaggiari C and Smithies R 2015. Eucla Basement Stratigraphic Drilling Results Release Workshop: Extended Abstracts, Record 2015/10. Geological Survey of Western Australia.
Wedepohl KH 1995. The composition of the continental crust. Geochemica et Cosmochimica Acta 59:1217–1232.


