
Full title:
Basins and Ranges: a cross-section through sedimentation and tectonism along the Delamerian-Lachlan deep crustal seismic line 22GA-DL1
Tom Wise1,2, Michael Doublier3, Wolfgang Preiss1, Mark Pawley1,2, Stephan Thiel4, Carmen Krapf1,2, Rashed Abdullah1,2, Claire Wade1,2, Roger Miller3, Ross Costelloe3, Muhammad Hossain3, Haroon Rasheed3 and Malcolm Nicoll3
1 Geological Survey of South Australia, Department for Energy and Mining
2 MinEx CRC
3 Geoscience Australia
4 CSIRO, Mineral Resources
Download this article (PDF 8.7 MB)
Published July 2025
On this page
Introduction
Globally, deep crustal seismic surveys have been used to investigate crustal architecture, crust- formation mechanisms, and to study mineral system settings (e.g. Clowes 2010; Goleby et al. 1989; Dentith et al. 2018; Drummond et al. 2006; Kennett and Saygin 2015; Korsch and Doublier 2015; Kennett et al. 2016; Mandal et al. 2018). In addition to providing information about the fundamental structure of the crust, there is increasing recognition of the ability of seismic and complimentary deep-penetrating geophysical techniques like magnetotellurics (e.g. Dentith et al. 2018; Wise and Thiel 2020) in mapping ‘vertically accretive structures’ (McCuaig and Hronsky 2014) exploited by lithospheric-scale mineral systems such as Olympic Dam (Heinson et al. 2018). These co-located surveys can map both crustal architecture and modification processes particularly important for ore formation, such as zones of fluid/magma flux, and alteration, and have already been used successfully in the Delamerian Orogen to identify fluid pathways (Robertson et al. 2015; 2017).
Deep crustal seismic reflection surveys across Australia have a proven track record as a critical dataset to understand crustal composition and architecture, structural and tectonic framework, and broad-scale mineral prospectivity, especially where they provide continuous sections across entire orogens. Prior to 2022, the most relevant examples to the Delamerian Orogen were the transects acquired in Victoria in 2006 and 2009 (06GA-V1 to V4, 09GA-SD1 and 09GA-AR1), which extend across the Lachlan Orogen and eastern Delamerian Orogen. They have provided valuable information for the development of the models of the crustal architecture, tectonic evolution and mineral systems of this region (Cayley et al. 2006; Cayley 2011; Cayley et al. 2011). In addition, the Curnamona-Gawler seismic transect (09GA-CG1) provides insights into the crustal architecture in the northern part of the Delamerian Orogen (Preiss et al. 2010), and the Broken Hill and Koonenberry surveys partly cover the northeastern Delamerian Orogen (lines 96AGS-BH1b and 96AGS-BH3, 99AGS-C1; Gibson et al. 1998; Mills and David 2004).
As part of the 2020–2024 Exploring for the Future program, Geoscience Australia acquired new deep seismic reflection data in the Delamerian Orogen in 2022. Five lines formed two traverses in the northern and southern part of the orogen (Doublier et al. 2024).
The southern ‘Delamerian-Lachlan’ traverse includes two lines, the western 22GA-DL1 (total length of 446 km), and eastern 22GA-DL2 (total length of 249 km; Fig. 1). The westernmost segment of 22GA-DL1, approximately 130 km, features semi-exposed rocks from the Adelaide Superbasin (Lloyd et al. 2020; A-A’ in Fig. 1) before reaching the western edge of the Cenozoic Murray Basin. Line 22GA-DL1 continues eastward across the Murray Basin cover, striking north-south at the South Australia-Victoria border. The east-west 22GA-DL2 line (Doublier et al. 2024) crosses the Grampians- Stavely Zone and extends into the Stawell Zone of the Lachlan Orogen, where it terminates west of the Avoca Fault, which marks the boundary with the adjacent Bendigo Zone to the east (Cayley et al. 2011).
Broadband magnetotelluric (MT) surveys were carried out broadly collocated with seismic lines 22GA-DL1 and 22GA-DL2, with additional stations collected west of 22GA-DL2 (Fig. 1). The MT surveys complement the interpretation of the deep crustal seismic data and further refine publicly available AusLAMP and broadband MT models of the region (e.g. Robertson et al. 2020).
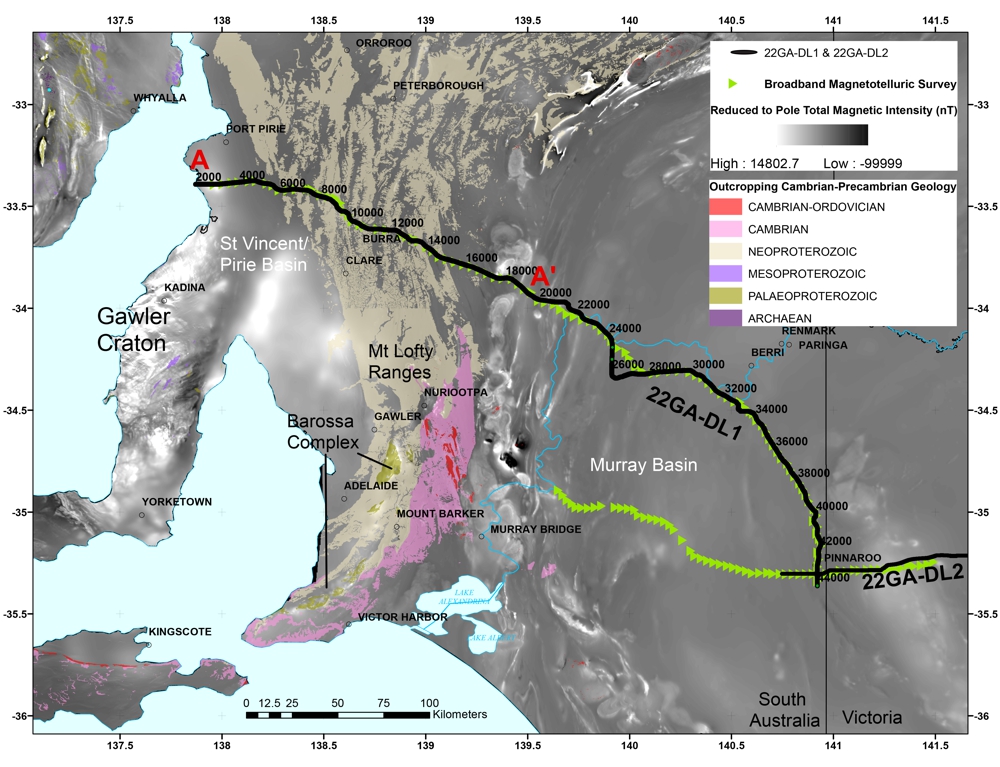
Figure 1 Regional magnetic map (Minty and Poudjom Djomani 2019) showing the location of seismic line 22GA-DL1 (black line) and magnetotelluric surveys (green triangles) in the context of outcropping Cambrian-Precambrian geology (shown in colour; Depth to Crystalline Basement Data Package (2018)) and regional tectonic structure. A-A’ shows the location of the cross section in Figure 4.
Here we present an interpretation of seismic line 22GA-DL1, which in conjunction with line 22GA- DL2 provides a ~600 km transect across a large portion of the western Tasmanides, complementing pre-existing legacy seismic data. The seismic line was designed to intersect several major Delamerian to neotectonic structures at a high angle, and to maximise the constraints provided by drillholes into covered geology.
The seismic line aims to answer such questions as:
- What is the distribution of the main geological units under cover and at crustal scale?
- What is the Neoproterozoic and Cambrian rift architecture, thickness, and relationship with Mesoproterozoic and older basement?
- What is the architecture of Phanerozoic basins overlying Delamerian basement?
- Which structures are crustal scale and connect to or offset the mantle, and what are their geometries?
- Is there connectivity between near surface faults and crustal-scale structures, and what is their potential as magma and fluid pathways, indicating the presence of mineral systems?
Regional geology
The 22GA-DL1 seismic line crosses several geological features that partly differ in regard to lithological assemblages, their stratigraphic and magmatic age record, and geological history. In this section we summarise, from oldest to most recent, the history of the relevant geology.
The oldest block is the Archaean to Mesoproterozoic Gawler Craton, which forms the exposed basement at the western end of the line and extends to the east under younger basins.
The Gawler Craton and Curnamona Province are key parts of the larger South Australian Craton (Myers et al. 1996). During the Proterozoic, the South Australian Craton, then part of the Mawson Continent that can be traced into Antarctica, may have also linked to sections of Laurentia, reflecting various configurations tied to the formation of the supercontinent Nuna (e.g. Payne et al. 2009).
The easternmost part of the South Australian Craton underwent extensive rifting coeval with the Kimban Orogeny (1730–1690 Ma) on the Gawler Craton. Sedimentary and volcanic rocks of the Willyama Supergroup were deposited in these rift basins, but probably also record a transition to post-rift thermal subsidence. Deposition spanned the period between 1720 Ma and 1640 Ma and was terminated by the Olarian Orogeny at 1620–1590 Ma. Although now exposed only in the Curnamona Province, the Willyama Supergroup is part of a much more widespread late Palaeoproterozoic depositional system extending to Mt Isa (QLD) and the McArthur Basin (NT) (Page et al. 2005).
The Kimban Orogeny was followed by deposition in several late Palaeo- to Mesoproterozoic sedimentary basins across the Gawler Craton, including isolated depocentres containing the Tarcoola Formation and Corunna Formation. In the eastern Gawler Craton deposition formed the protolith to the c. 1650 Ma Barossa Complex (e.g. Jagodzinski et al. 2020). The Barossa Complex, which forms the basement beneath the Neoproterozoic-Cambrian Adelaide Superbasin (Lloyd et al. 2020) in the Mount Lofty Ranges, is the southeasternmost known part of pre- Neoproterozoic Australia. Its sedimentary protolith is thought to be part of a series of eastward-younging basins on the margins of the South Australian Craton (Jagodzinski et al. 2020). Detrital zircon age populations also indicate a close relationship between the Barossa Complex and the Curnamona Province, suggesting they were part of the same depositional basin and orogenic belt (Jagodzinski et al. 2020). The metasedimentary successions of the Barossa Complex and Willyama Supergroup of the Curnamona Province, indicate a shared early Archaean to Paleoproterozoic provenance, suggesting a combined source from the central- western Gawler Craton and the North Australian Craton. This common provenance supports the hypothesis that the Gawler and North Australian cratons were once contiguous during the late Paleoproterozoic (Jagodzinski et al. 2020).
Late-tectonic granites intruded the Curnamona Province at c. 1590 Ma, coeval with the Gawler Range Volcanics and Hiltaba Suite of the Gawler Craton (1595–1586 Ma; Jagodzinski et al. 2023). The Gawler Range Volcanics and Hiltaba Suite magmatism coincided with widespread deformation and metamorphism, collectively referred to as the Olarian Orogeny (c. 1630–1540 Ma), which impacted on the northern and southeastern regions of the Gawler Craton, and the (then likely contiguous) Barossa Complex and Curnamona Province (Morrissey et al. 2013). The Olarian Orogeny was generally west-vergent, with intense deformation and metamorphism extending to the Wallaroo Group at the eastern edge of the Gawler Craton and open folding and reverse faulting of the Corunna Formation.
The Willyama Supergroup and Olarian deformation and metamorphism are likely to extend at depth south and west of the outcrops in the Curnamona Province. The occurrence of c. 1600 Ma high grade metamorphic xenoliths in the Calcutteroo Kimberlite (Chen et al. 1994), approximately mid-way between the Curnamona Province and the basement inliers of the Mount Lofty Ranges, suggests a continuous Olarian orogenic belt beneath the Adelaide Superbasin.
In the eastern part of the Gawler Craton, c. 1490 Ma intracratonic rifting formed the north-northwest-trending Carriewerloo Basin, which was filled with continental sediments of the Pandurra Formation (Beyer et al. 2018).
The Adelaide Superbasin, as described by Lloyd et al. (2020), is an extensive sedimentary system that was active from the Neoproterozoic to the middle Cambrian, spanning ~300 million years. The Superbasin encompasses early rift units, the relatively undeformed platform sediments of the Stuart Shelf and Coombalarnie Platform, and the Cambrian Arrowie and Stansbury basins and Kanmantoo Trough. The Adelaide Superbasin has a complex depositional history that records the breakup of the supercontinent Rodinia and has been reviewed in detail by Preiss (1987; 2000), Counts (2017), and Lloyd et al. (2020; 2022). The basin initiated as an intracontinental rift system after c. 900 Ma (Lloyd et al. 2022), transitioning to a passive margin in the southeast while remaining a failed rift in the north (Lloyd et al. 2022; Powell et al. 1994; Preiss 2000). Extension in the early- middle Cambrian produced platform-dominated sedimentary sequences contemporaneous with the initiation of west-directed subduction on the east Gondwanan margin, transitioning to rapid deposition of clastic-dominated sequences during rifting (Foden et al. 2020; Haines et al. 2009).
The stratigraphy of the Adelaide Superbasin is divided into three supergroups (e.g. Preiss 2000), the first two representing Neoproterozoic sequences and the third Cambrian sequences, each containing several group and subgroup divisions.
In South Australia, the supergroups of the Adelaide Superbasin are:
- the Neoproterozoic Warrina Supergoup, consisting of the Callanna and Burra groups, which was deposited in fault-bound troughs during tectonic subsidence (Powell et al. 1994).
- the Neoproterozoic Heysen Supergroup, including the Umberatana and Wilpena groups. The Umberatana Group includes at its base the Yudnamutana Subgroup (Sturtian glacials) which records the last phase of Neoproterozoic extension, forming the Baratta and Yudnamutana troughs. Following, a period of thermal sag, rather than extension, accommodated deposition (Preiss 1987).
- the Cambrian Moralana Supergroup, including the Kanmantoo and Normanville groups.
Deposition within the Adelaide Superbasin was terminated by the Delamerian Orogeny at c. 514–490 Ma (Foden et al. 2006; 2020; Preiss 2000).
The Delamerian Orogeny marks the beginning of the subduction of the proto-Pacific oceanic lithosphere along the rifted and extended passive margin of the Gondwana supercontinent (Foden et al. 2006; Foden et al. 2020; Rosenbaum 2018). The Delamerian Orogen is most extensively exposed in South Australia, where deformation affected the Neoproterozoic stratigraphy (Preiss 2000) as well as the early Cambrian-aged Normanville and Kanmantoo groups (Haines et al. 2001). This exposed section, known as the Adelaide Fold Belt, forms the Flinders Ranges to the north and the Mount Lofty Ranges to the south. In the southern Mount Lofty Ranges, the Neoproterozoic to Cambrian succession was metamorphosed to amphibolite facies and exhumed in a west-verging fold and thrust belt (Alias et al. 2002; Offler and Fleming 1968; Sandiford et al. 1992; Flöttmann and James 1997). Bimodal magmatism accompanied the deformation (Foden et al. 2002), but also predates and postdates the Delamerian Orogeny across the broader orogen (Foden et al. 2020).
Late Palaeozoic sedimentation occurred in discrete structurally controlled basins to the east of the Flinders-Mount Lofty Ranges. The late Silurian to early Carboniferous western Darling Basin, a northeast trending structural basin bound to the northwest by the Hamley Fault, is filled with clastic sediments including continental redbeds and marginal marine facies (Alley 1995; Hou and Petts 2021). The early Permian Nadda Basin is filled with glaciomarine sediments that are preserved in structurally controlled depressions, which unconformably overly the Darling Basin and Cambrian Kanmantoo Group (Alley 1995; Thornton 1974). The sediments of the Nadda Basin are present in the subsurface of the northwestern Murray Basin and have recently been identified in the Karoonda area (Stoian and Wise 2023).
West of the Flinders-Mount Lofty Ranges, the St Vincent and Pirie basins evolved from terrestrial to marine depocentres during the middle Eocene to the Miocene. This was followed by a return from marine to terrestrial conditions in the early Miocene, before deposition was terminated by tectonism in the middle Miocene (McGowran and Li 1997; Preiss 2019).
East of the Flinders-Mount Lofty Ranges, Cenozoic sediments were deposited in the Murray Basin, a large intra-cratonic basin that covers ~300,000 km² across South Australia, Victoria, and New South Wales. The Cenozoic sediments unconformably overlie both Neoproterozoic- Cambrian and mid-Palaeozoic-Mesozoic rocks (Brown and Stephenson 1991). The Murray Basin stratigraphy has been recently reviewed by Hou and Petts (2021).
The Flinders-Mount Lofty Ranges also have a neotectonic history. Preiss (2019) provides a thorough review of the tectonic history of fault systems surrounding the Adelaide area. This work examined recent uplift on major scarp-forming faults, recognising that these structures have a multi-phase reactivation history that extends from >830 Ma to the present day.
Methods
Seismic data acquisition and processing
The seismic survey and data acquisition for line 22GA-DL1 was carried out from May to August 2022 by Terrex Seismic. The deep seismic reflection data were recorded using an active spread of 1,600 channels over 16 km. DTCC SmartSolo IGU-16 10 Hz Nodes were used in the receiver array, with a single node per station. The symmetrical source array, consisting of three Inova AHV-IV PLS364 62,000 lbs vibrators, was used with a nominal maximum source-to-receiver offset of 8 km. The vibrators were spaced with the pads
12.5 m apart, giving a total source array length of 25 m. Vibration point intervals were 40 m, and the centre of the vibrator array was located midway between receiver stations.
Data processing was split into two separate workflows, one for whole crustal imaging with a 20-second record length, and a second targeting upper crustal and basin features with an 8-second record length. Processing workflows were optimised for their respective targets. Crooked line geometry, statics calculation, velocity analysis, noise attenuation, and deconvolution steps were applied during data processing. The data underwent pre migration Dip Moveout stack (DMO), Pre stack Time Migration (PSTM), and Post stack Time Migration (PoSTM). A display of the PoSTM section is shown in Figure 2, and the processed seismic data package is available via the following link: https://pid.geoscience.gov.au/dataset/ga/147423 (Geoscience Australia 2023).
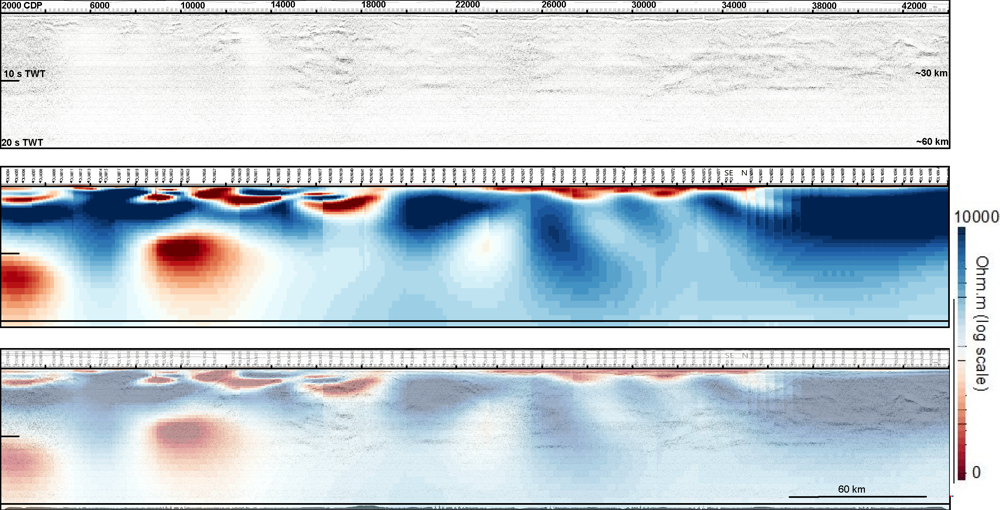
Figure 2 Top: Processed seismic image of 22GA-DL1. Middle: Slice through three-dimensional resistivity model of broadband magnetotelluric data. Bottom: Resistivity model semi-transparent over seismic image. Northwest to southeast, left to right.
Line description
The data quality along seismic line 22GA-DL1 is good overall, imaging the seismic character of the entire crust. The data reveals two broad crustal domains, with a more layered, slightly thinner crust in the eastern two thirds of the line (east of CDP 18,000), and a more homogenous, thicker crust in the western part (Figs 2 and 5).
Two subvertical corridors between common depth points (CDPs) 4,400 and 10,400, and 12,500 and 13,700 show less reflectivity in the middle and lower crust, making a detailed interpretation challenging. These areas correspond to days of higher wind speeds and rainy weather conditions during data acquisition and this seismic noise could be diminishing seismic reflections.
Changes in seismic amplitude along 22GA-DL1 may also be related to changes in the angular relationship between the seismic profile,
constrained by variable orientations of pre-existing roads, and the regional geology. This is the case for the area between CDPs 26,400 and 29,800. This area corresponds to a ~35 km-long segment of east-west oriented road following a sharp bend at CDP ~26,400 (Fig. 1), and shows overall lower seismic amplitudes compared to similar/ continuous geology on either side. While such a major bend is easily recognised in a plan view display of the seismic line (Fig. 1), smaller and less obvious bends may also cause significant changes in both amplitude and reflector orientation. This can be observed at CDP ~17,700 (Figs 1 and 3), underpinning the necessity of data visualisation in 3D to avoid misinterpretation. These bends can also be inferred by higher fold within the bends. More traces are binned in bends due to equal CDP spaced stacking using 2D smoothed crooked line geometry. Viewing the fold plot can be a useful first indicator of bends in the line.
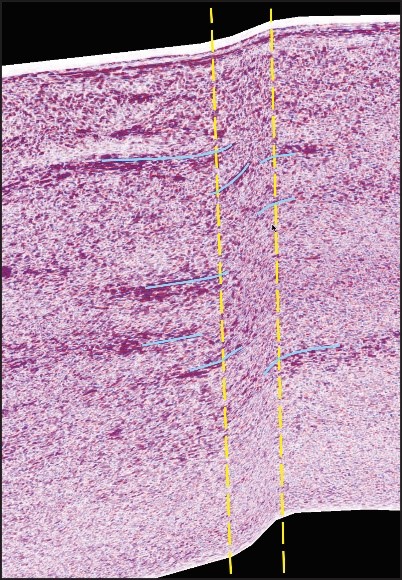
Figure 3 3D visualisation of 20 sec PoSTM seismic data between CDPs 16,500 and 19,000 crossing an S-bend. The yellow lines show the position of the vertices, and the blue lines delineate some of the reflector pattern over the area of interest. Note the effect of the bend on the dip of reflectors, but also on the appearance of reflective packages and amplitude.
Magnetotelluric data acquisition and processing
A total of 222 broadband magnetotelluric (MT) sites were collected by Zonge Engineering along two main profiles (Fig. 1). A southern profile extends across the Murray Basin from Murray Bridge in South Australia to Swan Hill in Victoria. Near the Victorian- South Australian border, this profile joins up with, and continues along the 22GA-DL2 seismic transect (Fig. 1). A northern profile extends from the Spencer Gulf in South Australia to Pinnaroo on the Victorian- South Australian border, following the 22GA-DL1 seismic transect (Fig. 1). Magnetotelluric data and accompanying models are available via the following link: https://pid.sarig.sa.gov.au/model/mesac30546 (Thiel 2024).
Each MT station recorded five components (Bx, By, Bz, Ex, Ey,) using Phoenix MTU-5C recorders at a minimum of 40 hours for most sites, which were converted to periods between 10−4−5×10³ s. Data were cleaned of outliers and rotated to strike for subsequent 2D modelling.
Magnetotelluric profile along 22GA-DL1
The MT data along the northern profile shows two distinctive regions, which can be distinguished based on their dimensionality and depth to basement. The western end of the profile (~150 km inland from the Spencer Gulf) shows a departure of 1D MT responses, representative of sedimentary cover, at periods of around 10-3 to 10-2 s. Furthermore, the basement in the western part shows a strong 3D response exemplified by phase tensor skew values >3° (Caldwell et al. 2004). There is a gradual shift to longer periods of the transition from 1D sediment responses to the 2D/3D nature of the basement towards the eastern half of the profile. This supports geological observations of thickening of the sediments across the Murray Basin across the eastern half of the profile.
Based on the data observations, a three-dimensional inversion is required of the MT data along the 22GA-DL1 profile. The modelling grid and data were rotated to N36°E to align with profile orientation and geoelectric strike. The grid dimensions are 1350 m x 2000 m in the horizontal {x,y} direction with x aligned along the line of profile. The model domain includes topography with the first vertical layer thickness of 10 m increasing with depth by a factor of 1.1. An error floor of 3% on the impedance tensor components was chosen together with an error floor of 0.02 for the vertical magnetic transfer functions for 32 discreet frequencies in a period bandwidth from 0.0015 s to 2,500 s.
The 3D inverse resistivity model (Fig. 2) shows complex geometries in the western half of the profile as expected from the MT data. The models show several upper crustal conductors in the top 10 km (Fig. 2). At depths below 20 km there are two mid- to lower crustal conductors associated with the Nackara Arc conductor (Robertson et al. 2016). The upper crust beneath the Murray Basin is generally more resistive.
Interpretation
Interpretation workflow
The interpretation of the seismic reflection profile was conducted during a workshop hosted by Geoscience Australia in Canberra in August 2023, with subsequent ongoing analysis by all collaborators. This process combined traditional hardcopy interpretation on large paper plots with digital analysis using ArcGISTM and 3D visualisation (Doublier et al. 2015). The interpretation presented here is based on/driven by the PoSTM data, with both 8 s and 20 s data products utilised to inform the interpretation in the upper crust. DMO Stack and PSTM data have been considered on a case-by-case basis, for example to assess the effect of the migration and different processing workflows on the final data.
The interpretation and mapping of areas with similar seismic character (e.g. crustal layering, intrusions) were based on the length, amplitude, frequency, and orientation of seismic reflectors. Faults and shear zones were identified using criteria such as: (i) the termination or truncation of distinct seismic reflector sets; (ii) changes in the orientation of coherent reflector packages across specific zones, such as shifts in form line orientation; and (iii) variations in seismic character. However, care must be taken as these changes might also be influenced by factors like line geometry or acquisition conditions (e.g. wind noise) and may not necessarily represent geological boundaries or structures.
The interpretation was conducted in the time domain in which the data were acquired, that is, in two-way time (TWT) in seconds. To approximate depth, a P-wave velocity of 6,000 m/s for the basement was used, where 1 second of TWT corresponds to approximately 3 km depth. For the Adelaide Superbasin we used 5,000 m/s (depth of 2.5 km per 1 second TWT), for the Cretaceous stratigraphy, we used 3,000 m/s (depth of 1.5 km per 1 second TWT), and for the Murray Basin 2,000 m/s, which translates into 1 km per 1 second TWT.
During interpretation both the MT data and 2D gravity modelling were used as complementary datasets to further test and contextualise the seismic interpretation.
In line with Korsch et al. (2010), the term ‘seismic province’ is used to describe areas of the middle and lower crust that cannot be traced to the surface and exhibit a distinct seismic character different from adjacent domains.
The geology of the Mount Lofty Ranges is well exposed and characterised by a complex, often steeply dipping geology that is challenging to image and interpret with reflection seismic methods. To improve the interpretation, and to get maximum benefits of the exposed geology, a geological cross section was created along the seismic line (Fig. 4), and overlayed onto the seismic data. The cross-section assumes a generally concentric style of folding as suggested by bedding orientations at the surface, and mostly eastward-listric reverse faulting in the western area and westward-listric faulting in the eastern area. The section also assumes a decollement in evaporitic layers low in the sedimentary sequence so that the basement is decoupled and not involved in the folding. This contrasts with further south (in the Adelaide Hills), where the basement is intimately involved in the deformation, with basement-rooted extensional faults inverted as Delamerian-aged thrusts (e.g. Preiss 2019).
Consequently, where near-surface strata and structures have steep dips, a combination of surface structural constraints and the seismic reflector pattern was used to guide interpretation in the upper 1–2 km, below which the seismic data took precedence. This was achieved by overlaying the upper part of the surface-constrained cross section (Fig. 4) over the processed seismic imagery.
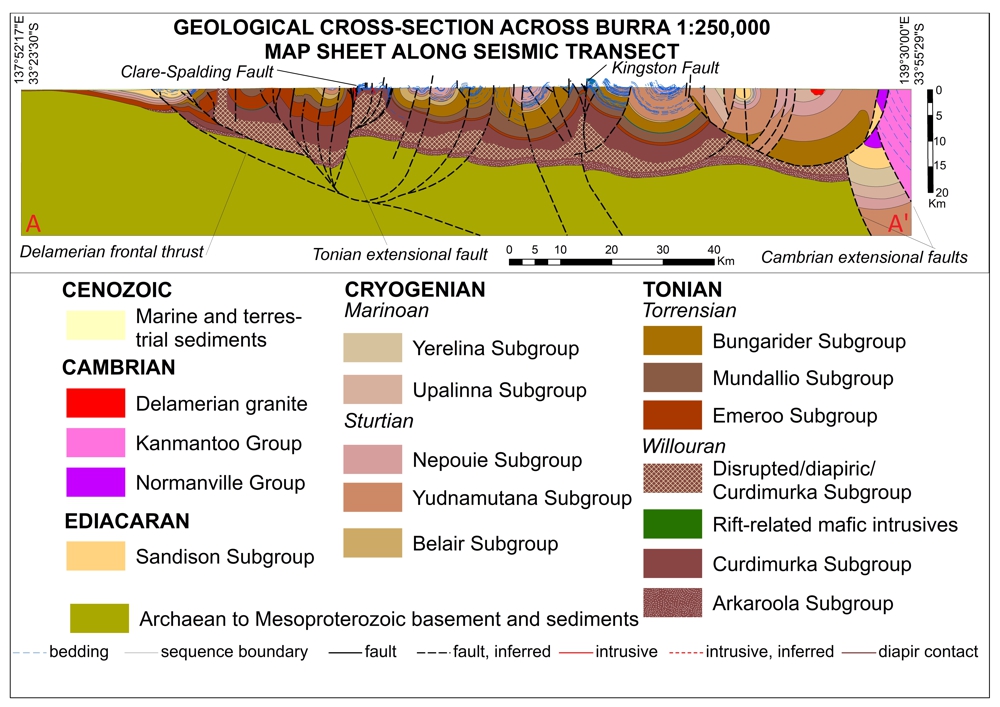
Figure 4 Geological cross section along the seismic line (Fig. 1; A-A’).
Geological interpretation
The 22GA-DL1 seismic profile has allowed for the interpretation of the major elements of the crustal profile defining the crustal architecture, such as crustal blocks, basins, and structural features. When assessing the observed geometries the angular relationship between the seismic profile and the regional geological trend varies, which may cause geometric affects such as changes in apparent dip magnitude (Fig. 3).
Overview
The first order observations are briefly summarised here and described in greater detail below. The seismic profile shows a semi-coherent layer that can be traced across the entire profile, tapering from full crustal thickness at the western end to a lower crustal layer in the central and eastern parts of the profile. The basal layer is interpreted as cratonic basement. Between CDP 12,700 and 27,000, the cratonic basement is overlain by a mid-crustal package that has no exposed equivalent and is hereby named the Koomooloo Seismic Province. The cratonic basement and Koomooloo Seismic Province are overlain by a series of stacked, overlapping seismically distinct packages that are interpreted as younger basins that correlate with outcrops and rocks intersected in drillholes. These include the Neoproterozoic package, which is exposed between CDP 3,000 and 19,000, but can be traced to the eastern end of profile as a mid- crustal layer, and the Cambrian-aged package that forms the uppermost crystalline unit in the central and eastern parts of the profile. The profile reveals several steep, moderately east- and west-dipping large- to crustal scale structures. They show both listric and planar geometries and often bound the different basement blocks and/or middle- and upper-crustal packages.
Major structures
Our interpretation reveals several major structures (Fig. 5) that vary in terms of depth extent, dip direction, and geometry. These structures are briefly described below from west to east. When assessing the geometries observed, it is worth considering that they have undergone a complex geological evolution with several orogenic episodes, resulting in possible (multiple) reactivation and out-of-plane movements. Kinematic analysis based on the 2D seismic section alone is therefore non- trivial. However, as these structures can often be recognised in the aeromagnetic data, it is possible to get further constraints on the kinematic evolution and determine an apparent sense of shear.
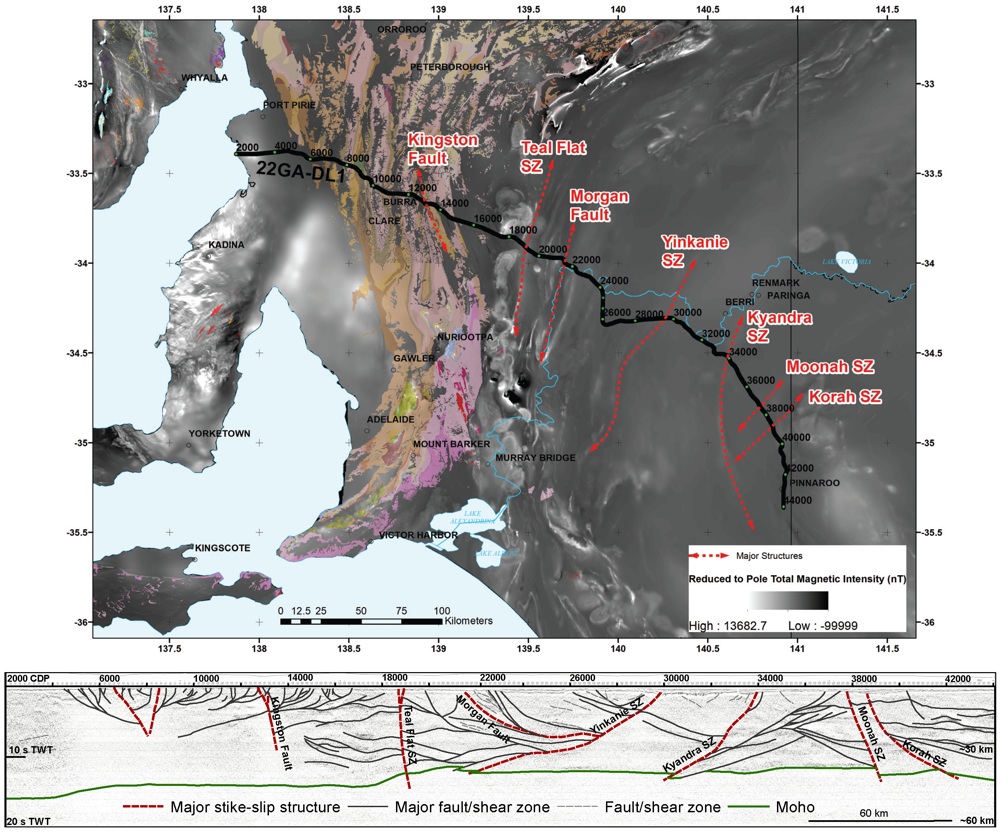
Figure 5 Top: Map from Figure 1 with major structures sketched in plan view. SZ denotes shear zone. Bottom: Interpreted fault and shear zone structures from 22GA-DL1 over seismic image. Major shear zones highlighted in red.
Kingston Fault
The Kingston Fault (CDP 12,700–13,200; Fig. 5) represents a steeply east-dipping structure, which has multiple splays above 1 s TWT. Beneath 2 s TWT the Kingston Fault corresponds to a crustal-scale zone of low seismic reflectivity. This structure juxtaposes reflective packages of different thickness in the middle crust, facilitates upwarping of Burra and Callanna groups’ stratigraphy, and in places offsets shallowly west-dipping structures (likely involving strike slip movement). The Kingston Fault is interpreted to have a complex reactivation history pre-and post-Delamerian Orogeny, likely originating as a growth fault during Proterozoic rifting (e.g. Preiss 2000; Preiss et al. 2009).
Given the close proximity of the Burra copper deposit to the Kingston Fault and studies linking zones of low seismic reflectivity to mineral systems (Heinson et al. 2018; Wise and Thiel 2020), it is plausible to draw a causative link between mineral system genesis and geophysical signature at Burra (e.g. Kay et al. 2024 using magnetotellurics). However, instead we suggest that the low reflectivity zone is more likely to be related to neotectonic activity (e.g. the 1997 ML 5.1 Burra earthquake; Mountford et al. 1997) rather than a fossil plumbing system for c. 790 Ma mineralisation (Preiss et al. 2009).
Teal Flat Shear Zone
The Teal Flat Shear Zone (Fig. 5) is interpreted to be a crustal-scale sub-vertical shear zone that juxtaposes sedimentary packages of different ages in the upper crust, offsets low-angle thrust faults in the upper and mid crust, and disrupts the Moho. We interpret this structure to have a complex history, with unclear origins (e.g. Burtt et al. 2000). We infer the main period of movement to be late-post Delamerian Orogeny, since this structure truncates earlier Delamerian thrust faults (Fig. 5). We interpret the Teal Flat Shear Zone to dominantly record strike-slip movement (kinematic unknown) although it is also likely to have a dip-slip component. Strike-slip movement is also supported by sub-horizontal lineations and steeply plunging drag folds observed in outcrops of highly foliated metavolcanic rocks (Teal Flat Volcanics). The Teal Flat Shear Zone may represent a segment of a much longer structure to the north and south (e.g. Coorong Shear Zone of Gibson et al. 2013).
Morgan Fault
Deflection of the Murray River (Figs 1 and 5) and thickness changes of Murray Basin sediments either side of the Morgan Fault (Preiss 2019) indicates the presence of neotectonic movement. The present-day fault expression is defined by a low neotectonic scarp, with west-side-up displacement.
Beneath the present-day scarp is a crustal-scale, east-dipping listric structure that soles at 5 s TWT (CDP 21,500; Fig. 5), where it is truncated by the Yinkanie Shear Zone to the east. The relationship between major crustal structure and the neotectonic feature is not able to be reconciled in the seismic imagery.
Yinkanie and Kyandra shear zones
The Yinkanie and Kyandra shear zones are sub- parallel north-northeast trending, west-dipping structures (Fig. 5) that are interpreted to record both Delamerian Orogeny compression, and subsequent strike-slip re-activation. Both structures are crustal-scale and appear to offset the Moho.
The Yinkanie Shear Zone marks the eastern boundary of a mid-crustal reflective package in the hanging-wall (i.e. the Koomooloo Seismic Province; Fig. 8), and the western end of a thin reflective lower crustal layer that may represent an underplate. The Yinkanie Shear Zone is interpreted to represent a boundary between differing deformation styles observed in drill core, with ductile deformation partitioned into the hanging-wall and only brittle fracturing in the footwall (Wise 2023). Drillhole evidence supports a compressive phase of movement on the Yinkanie Shear Zone.
The Kyandra Shear Zone appears to offset the Neoproterozoic and younger packages in the upper crust with an apparent normal offset. The Kyandra Shear Zone also forms the boundary between moderately reflective crust interpreted to be thinned and extended Gawler Craton to the west, and a more reflective middle and lower crust in the footwall to the east.
Moonah and Korah shear zones
The Moonah and Korah shear zones are parallel, and are interpreted to strike northeast, dipping to the southeast (Fig. 5). The Moonah Shear Zone and Korah Shear Zone both are crustal-scale structures that appear to offset the Moho with a normal sense of movement, whereas some boundaries in the upper crust are offset with a reverse sense of movement, suggesting strike-slip movement. These structures are oblique to the Kyandra Shear Zone and are interpreted to have a different history. Figure 5 shows these shear zones sitting at the northwestern end of a highly magnetic region of western Victoria (Stavely Zone). We interpret movement on the Moonah Shear Zone and Korah Shear Zone to have accommodated movement at the northern end of the Stavely Zone during oroclinal bending of the Tasmanides during the early Palaeozoic (e.g. Cayley 2012; 2015)
Moho
The Moho along line 22GA-DL1 shows significant variation in definition, character, and topography (Fig. 5). In most parts of the line, it is well defined as a sharp to gradual change from a variably reflective lower crust to a non-reflective mantle, but it is relatively poorly imaged in some areas. Beneath the Gawler Craton on the western end of the line, the Moho is at its deepest (~16 s TWT), corresponding to a crustal thickness of ~48 km. In the area of higher noise levels east of CDP 4400, it is not well defined and tentatively interpreted at ~14 s TWT (corresponding to a crustal thickness of ~38–40 km taking into consideration the upper crustal Neoproterozoic strata).
A relatively sharp change in crustal thickness is observed in the vicinity of the Teal Flat Shear Zone, to the east of which the Moho is imaged between 11.5 and 13.0 s TWT, before reaching 13.2 s TWT at the eastern end of the line. This corresponds to a crustal thickness between 31 to 34 km, when considering the Neoproterozoic and younger rocks in the middle and upper crust. The Moho topography east of the Teal Flat Shear Zone is largely controlled by offsets on the Yinkanie, Kyandra, Moonah and Korah shear zones (Fig. 5).
Geological elements
The following section describes the interpretation of geological features and major deformation events, largely in chronological order.
Cratonic basement and lower crust
Underlying Cenozoic and Neoproterozoic rocks, the bulk of the crustal section at the western end the profile shows a layer of moderately reflective to reflective crust down to ~16 s TWT, which we interpret to represent cratonic basement (Fig. 6).
Although the lowermost part below ~12 s TWT is slightly less reflective, this layer has a relatively homogenous seismic character with relatively short seismic reflectors that often lack coherency, hindering a detailed interpretation for the most part. This unit gradually thins to the east, where it is overall less reflective, reaching ~3.5 s TWT beneath CDP 17,000. From there to the east it forms the lower crust, ranging in thickness between 2.5 s and 3.5 s TWT, and ends at the Kyandra Shear Zone. Between CDP 17,400 to 22,000, this lower crustal layer is attenuated and disrupted by a series of shallowly-dipping shear zones. We attribute this zone of attenuation to disruption caused by strike- slip movement on the crustal-scale Teal Flat Shear Zone.
No major structural contacts are interpreted within the cratonic basement, indicating that the Barossa Complex and/or the Curnamona Province (along strike to the northeast) are unlikely to represent discrete blocks accreted onto the Gawler Craton.
The cratonic basement east of the Kingston Fault shows two prominent regions of low electrical resistivity (Fig. 2). These low resistivity zones are also observed in 3D models of wide-spaced long- period AusLAMP magnetotelluric data (Robertson et al. 2020). These two mid-lower crustal features form parallel northeast-oriented bands from the Yorke Peninsula to the southern edge of the Curnamona Province. Their northeasterly orientation is at odds with the ~north-south orientation of upper crustal (Delamerian) structures in this section of the line, and could represent an inherited crustal fabric from the earlier Proterozoic, though seismic reflectivity in this line is unable to provide support for this interpretation.
East of the Kyandra Shear Zone, the lower crust has several mainly sub-horizontal reflective layers and is more reflective than the interpreted Gawler Craton to the west. It is also slightly thicker, ranging between 3.5 s and 5 s TWT. Based on the distinctive seismic character and thickness, we newly name the lower crust the Paruna Seismic Province. However, we speculate/propose that this crust is likely to be compositionally similar to, and share a common history with, the Gawler Craton.
West of the Yinkanie Shear Zone, between CDP 22,000 to 31,000, and from CDP 32,000 to 39,000, the base of the crust is formed by a reflective layer with a thickness between 0.5 s and 1.3 s TWT, referred to as ‘reflective lower crust’ (Fig. 6). As this layer is only observed where the crust has been subjected to Cambrian extension and basin formation (see below), we speculate that this layer might represent a Cambrian underplate.
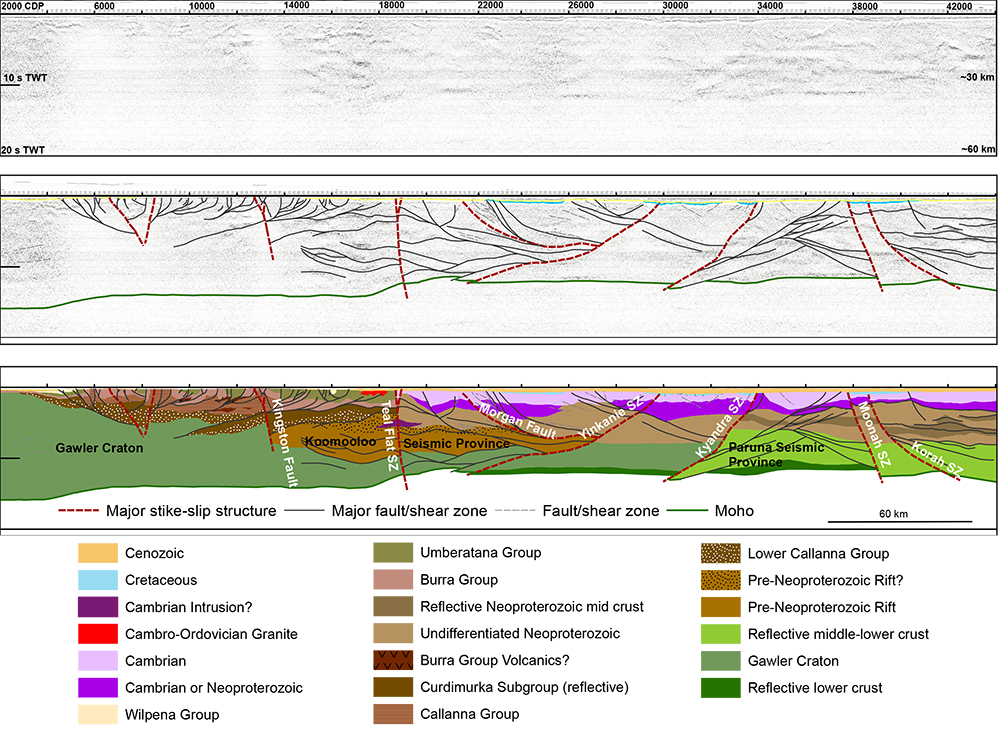
Figure 6 Geological interpretation of line 22GA- DL1. Top: Uninterpreted seismic image. Middle: Major structures and Cretaceous to Cenozoic basins (Cretaceous, blue; Cenozoic, yellow; line indicates base of basin). Bottom: Full polygon interpretation.
Pre-Neoproterozoic rift
The middle crust between the Kingston Fault (~12,700 CDP) and Yinkanie Shear Zone (~27,000 CDP) is characterised by a zone of sub-horizontal high-low amplitude reflective bundles, with intervening poorly reflective zones (Fig. 6). The zone is thickest at 17,600 CDP, reaching ~6.5 s TWT, and thins to the east and west. It displays a stronger reflectivity than the underlying Gawler Craton and has been mapped as the Koomooloo Seismic Province (new name). The reflectors in the Koomooloo Seismic Province have a similar wavelength of folding as reflectors in the overlying crust that were deformed during the Delamerian Orogeny. Given the improbability of the Neoproterozoic-Cambrian Adelaide Superbasin (Lloyd et al. 2020; Preiss 2000) reaching thicknesses of up to 30 km, we propose that the Koomooloo Seismic Province represents a sequence post-dating the Olarian Orogeny reworking of the Gawler basement (e.g. Morrissey et al. 2013), and older than the c. 830 Ma initiation of the Adelaide Superbasin (Lloyd et al. 2020).
In South Australia, the only preserved basin sequence within this 750 million year time bracket is the c. 1575–1490 Ma Cariewerloo Basin in the central Gawler Craton (Beyer et al. 2018). However, evidence of rifting within the supercontinent Nuna at this time may also be found farther afield (Morrissey et al. 2019; Mulder et al. 2015; Brown et al. 2024). The geographic location for the Koomooloo Seismic Province package would be along the same axis as a series of contemporaneous depocentres that can be traced from northern Australia, southwards into western Tasmania (Rocky Cape Group; Fig. 7), suggesting the rocks of the Koomooloo Seismic Province may record this extensional event (e.g. Mulder et al. 2015).
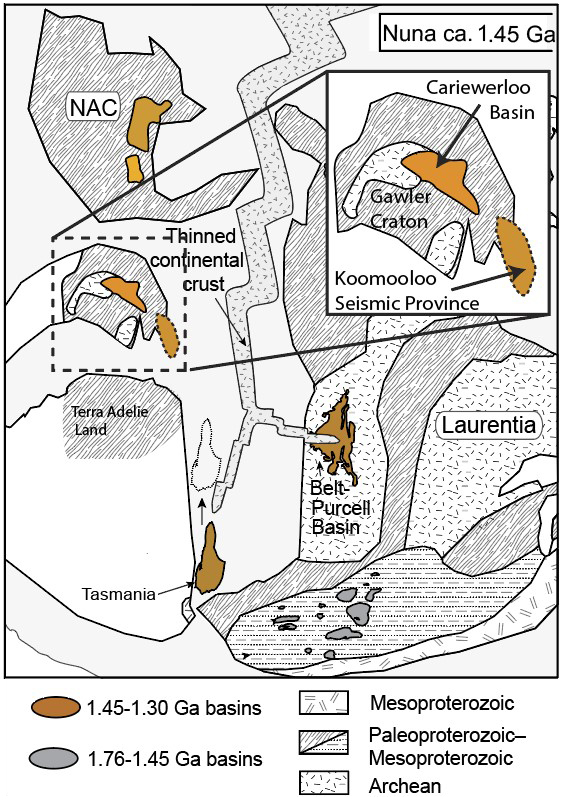
Figure 7 Cartoon illustrating an interpretation of the configuration of the supercontinent Nuna at c. 1.45 Ga (modified after Mulder et al. 2015), showing depocentres in the northern Australian Craton (NAC) and Tasmania.
Neoproterozoic
Neoproterozoic rift sequences are present across the line. West of the Teal Flat Shear Zone, the Neoproterozoic rocks crop out in the Mount Lofty Ranges (Figs 1 and 6). In the seismic profile, this sequence is up to 6 s TWT thick and laps onto the Gawler Craton basement in the westernmost part of the line. The sequence generally shows characteristics of an inverted basin and is characterised by thick stacked packages that are segmented by divergent low-angle thrusts, steep faults interpreted as strike-slip structures, and upright folds.
Aided by field constraints on outcropping geology in the Mount Lofty Ranges, packages of the Adelaide Superbasin have been delineated at the group level where possible (Fig. 8). Lower Adelaide Superbasin stratigraphy with distinct seismic characteristics and good surface constraints appear to be restricted to the western third of the line. The Curdimurka Subgroup of the Callanna Group is characterised by high amplitude reflectors, forming a prominent unit that does not appear to be present east of the Teal Flat Shear Zone, implying that deposition was controlled by growth structures active to the west of the Teal Flat Shear Zone. The lowermost part to the Lower Callanna Group is ubiquitous at the base of the Neoproterozoic sequence west of the Teal Flat Shear Zone. The Lower Callanna Group is generally uniform in thickness, but is locally thicker (~2.3 s TWT) between two steep structures with opposed dip directions that reach the surface at CDP 6,600 and 8,520, respectively. Structures show evidence of inversion and are dipping towards this zone, suggesting this area represents a depocentre in the western part of the Neoproterozoic basin.
The Callanna and Lower Burra groups also display a distinctive electrical response in MT models, characterised by low resistivity zones in the upper crust (Figs 2 and 8). The lack of depth fidelity/ constraints on non-depth converted seismic images prevents a more detailed assessment on which specific parts of the stratigraphy are more conductive.
East of the Teal Flat Shear Zone, the Neoproterozoic rocks form a mid- to upper-crustal layer that overlies the Koomooloo Seismic Province, the Gawler Craton, and Paruna Seismic Province, and in turn is overlain by Cambrian-aged units (Fig. 6). For the most part, the Neoproterozoic sequence is poorly reflective, although some moderately reflective layering is present in the mid-crust east of the Kyandra Shear Zone (mapped as ‘Reflective Neoproterozoic mid crust’). The cause of these reflective layers is unclear, with Neoproterozoic rift volcanics being a possibility, though potential field data shows no evidence for thick, deep-seated volcanic successions in this area.
The Neoproterozoic sequence varies in thickness and depth, due to attenuation and offset along shallowly dipping extensional shears (Fig. 6). The sequence reaches depths of up to 8 s TWT and is up to 4.5 s TWT thick. It is difficult to confidently subdivide the sequence east of the Teal Flat Shear Zone and therefore it is referred to as ‘Undifferentiated Neoproterozoic’. However, the high amplitude reflectors and low electrical resistivity zones that typify parts of the lower Adelaidean sequences to the west of the Teal Flat Shear Zone are not observed to the east. Consequently, the eastern part of the Neoproterozoic Adelaide Superbasin likely comprises equivalents of the upper Burra Group and Heysen Supergroup (Umberatana-Wilpena groups).
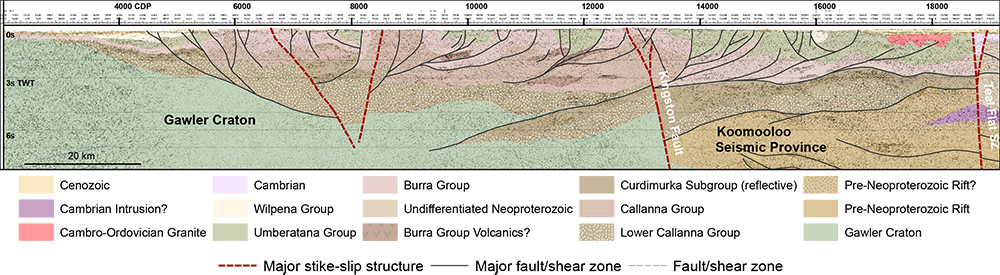
Figure 8 Zoomed-in section of the upper crust of the 22GA-DL1 line west of the Teal Flat Shear Zone, highlighting the Neoproterozoic stratigraphy and structural architecture.
Cambrian
Cambrian basin units and associated volcanic/ intrusive rocks are preserved east of the Teal Flat Shear Zone, where they form the upper crust (Fig. 6). This package is generally conformable, overlying the Neoproterozoic rocks. The upper crust has variable thickness along the profile, which is due to shears and faults with apparent extensional, and less common shortening, offset.
The Cambrian rocks can be divided into two main groups based on seismic characteristics. There is a lower unit with an overall homogenous moderate seismic reflectivity with occasional higher amplitude reflectors that is interpreted to represent possibly late Neoproterozoic or early Cambrian (e.g. Normanville Group) stratigraphy. It is therefore mapped as ‘Neoproterozoic or Cambrian’ (Fig. 6), based on the contrast in seismic character with the poorly reflective underlying ‘Undifferentiated Neoproterozoic’. This unit is generally present east of the Teal Flat Shear Zone, apart from one section (between CDP 25,700 and 27,700) where the underlying undifferentiated Neoproterozoic rocks rises to within 1 s TWT of the surface.
The upper Cambrian package, mapped as ‘Cambrian’ (Fig. 6), is present east of the Teal Flat Shear Zone. It is seismically more heterogeneous than the underlying ‘Neoproterozoic or Cambrian’, and in places has a moderately reflective base. The ‘Cambrian’ as interpreted has a variable thickness, is locally folded, and the base is offset by shear zones. Bimodal volcanics and felsic intrusions have been recognised in drilling and aeromagnetic imagery which likely account for areas of higher reflectivity (Jagodzinski et al. 2024), but these cannot be confidently recognised in the seismic profile.
The spatial relationship between the distribution of the Cambrian extension-related sediments and the reflective lower crustal layer suggests the layer is related to Cambrian extension and it is tentatively interpreted as a Cambrian magmatic underplate.
Extensional episodes Mesoproterozoic – Cambrian
The seismic interpretation indicates a complex structural history in the area. Structures to the west of the Teal Flat Shear Zone that were likely growth faults during deposition of pre-Neoproterozoic and Neoproterozoic sediments have been re-activated as reverse or strike-slip faults during the Delamerian Orogeny and later events. East of the Teal Flat Shear Zone, some Neoproterozoic and Cambrian packages display thickness changes near structures that imply that growth faulting played a significant role in basin development (Fig. 6).
Cambrian-Ordovician magmatism
Just west of the Teal Flat Shear Zone, a Cambro- Ordovician granite is interpreted in the upper crust (Figs 6 and 8). This interpretation is based on outcrop and aeromagnetic constraints. The controls on generation, transfer, and emplacement of this magmatic body are unclear, though it does sit above a zone of complex Moho topography, and where a proposed Cambrian magmatic underplate is conspicuously absent. Delamination of a Cambrian crustal underplate has been proposed as a mechanism for the generation of post-Delamerian A-type granites (Foden et al. 2020).
Delamerian Orogeny
Most major structures interpreted in the seismic profile appear to be shallowly- to moderately-east and west dipping shears and faults (Figs 5, 6 and 8). These structures have a component of apparent reverse movement indicated by the offset of the Moho and boundaries between the different units interpreted here. As these structures also offset packages interpreted to be Cambrian in age to the east of the Teal Flat Shear Zone, they are likely to have been (re)-activated during the c. 514–490 Ma Delamerian Orogeny. This is consistent with the Flöttmann and James (1997) interpretation that the inversion of syn-depositional growth faulting during the Delamerian Orogeny was a prominent process and mechanism of crustal thickening throughout the region.
Although difficult to reconcile at the scale of the seismic interpretation, drill cores through the Murray Basin intersected Cambrian units showing a range of deformation styles. Deformation ranges from ductile shearing to a weak mineral alignment (Jagodzinski et al. 2024), with higher strain and elevated metamorphic grades (to upper greenschist) dominant in the belt between the Teal Flat and the Yinkanie shear zones.
Transpressional deformation has been interpreted as a major feature of the Delamerian Orogeny (Marshak and Flöttmann 1996), with lower order shear zones with steep shear fabrics indicated by drill core and aeromagnetic imagery (Jagodzinski et al. 2024). However, these structures were either not prominent at the scale of the seismic line, or not recognisable in the seismic profile due to their steep attitude.
Post-Delamerian Orogeny
There is evidence for deformation that post-dates the Delamerian Orogeny. In the seismic profile, Delamerian-aged reverse faults are truncated by crustal-scale steep to moderately dipping structures, such as the Kingston Fault and Teal Flat Shear Zone (Figs 5 and 6). Recent Ar-Ar geochronology provides absolute constraints and indicates younger movement on some structures during the Ordovician (Reid et al. 2022; Naina 2024). In aeromagnetic data, these structures are parallel with the dominant north-south orientation of structural and lithological fabrics of the Cambrian and older units, and are interpreted to have experienced strike-slip motion after the Delamerian Orogeny.
We interpret the Moonah and Korah shear zones at the eastern end of the line to be ~northeast- southwest-trending based on potential field data. It is possible that these structures record strike-slip movement accommodating crustal rotation during c. 450–430 Ma episodes of the Lachlan Orogen (e.g. Cayley 2012, 2015).
Whilst the Darling Basin is present to the north of seismic line 22GA-DL1, and the Nadda Basin is present to the north and south (Stoian and Wise 2023), units of neither basin are recognised along the line, suggesting a local control on deposition or preservation.
Cretaceous basins
Deposits of the Cretaceous-aged Berri Basin are relatively thin. Depocentres are observed in several places along the eastern half of the line (e.g. near 30,000 CDP; Fig. 9), where they underlie Cenozoic- aged Murray Basin units (Murray and Renmark groups). Deposition appears to be in-part controlled by the location of major structures (e.g. Yinkanie and Kyandra shear zones), and small-scale faults are visible. In some areas there is evidence of compressive reactivation and inversion of growth faults (e.g. ~31,300, 31,700 CDP; Fig. 9), where reflectors show apparent thickening of packages towards the fault, which is interpreted to record syn- depositional faulting followed by inversion of that structure as a response to compression.
The overlaying Murray Basin units in this location are horizontal and display no sign of fault disturbance (Fig. 9), indicating that this phase of compressive deformation occurred in the early Cenozoic, prior to the deposition of the lower Murray Basin stratigraphy.

Figure 9 Upper crustal section showing the discernible Murray Basin stratigraphy (Murray and Renmark groups, combined as Cenozoic in Fig. 6), with Cretaceous-aged Berri Basin sediments overlying Cambrian basement. (Yellow line: base Murray Group; Brown line: base Renmark Group; Blue line: base Berri Basin).
Cenozoic basins
The Murray Basin is imaged in the seismic profile blanketing the eastern two thirds of the line, east of 14,900 CDP (Fig. 6). East of the Teal Flat Shear Zone, the Murray Basin has a simple stratigraphy, however, the crustal-scale seismic profile hasn’t been divided at group level. There is an upper unit of up to ~0.3 s TWT, comprised of the Murray Group limestones and calc-arenites, with a laterally continuous, high-amplitude reflector often defining the base of this package. Beneath this is a lower unit with a more variable character, ranging from irregularly faulted and chaotic appearance at the western margin of the basin (e.g. Fig. 6), transitioning to a more regular horizontal layered sequence to the east. This unit is interpreted to be the Renmark Group (Hou and Petts 2021), comprised of laterally variable facies including lignitic clays, sands, and silts.
Neotectonism
Neotectonism produced present day topographic features like scarps in the Mount Lofty Ranges (Preiss 2019). Observations from the seismic profile indicate that the neotectonic structures are connected to deep-seated extensional crustal faults with multiple contractional reactivation histories dating back to the Cambrian-aged Delamerian Orogeny, and possibly even earlier (Flöttmann et al. 1998).
Records of earthquake activity show a variety of hypocentres located both in the vicinity of interpreted fault planes (e.g. Mountford et al. 1997), but also in areas of low seismic reflectivity.
Key findings and implications
The interpretation of line 22GA-DL1 has revealed the architecture of basinal sequences overlying the eastern margin of the Gawler Craton from the Mesoproterozoic to the Cenozoic, and the effects of multiple tectonic events.
The eastern margin of the Gawler Craton displays many similarities with a typical cratonic edge, being stacked with basins due to repeated extension and the focus of episodic contraction. Deformation associated with contractional (and transpressional) episodes is preferentially focused into zones that have seen rift-related extension and deposition. Consequently, many faults and shear zones interpreted across the line have a history of multiple reactivations.
Key new observations from this interpretive study relate to the thickness and extent of lower groups of the Adelaide Rift Complex (Burra and Callanna groups) and the Koomooloo Seismic Province, as well as the likely continuation of cratonic basement across the line. Significant thicknesses of Meso- Neoproterozoic rift sequences, likely to include mafic volcanics, represent a fertile source region for sediment-hosted mineral systems, especially where subsequent deformation and thermal events can mobilise metal-laden fluids (e.g. Hitzman et al. 2010; Fig. 10).
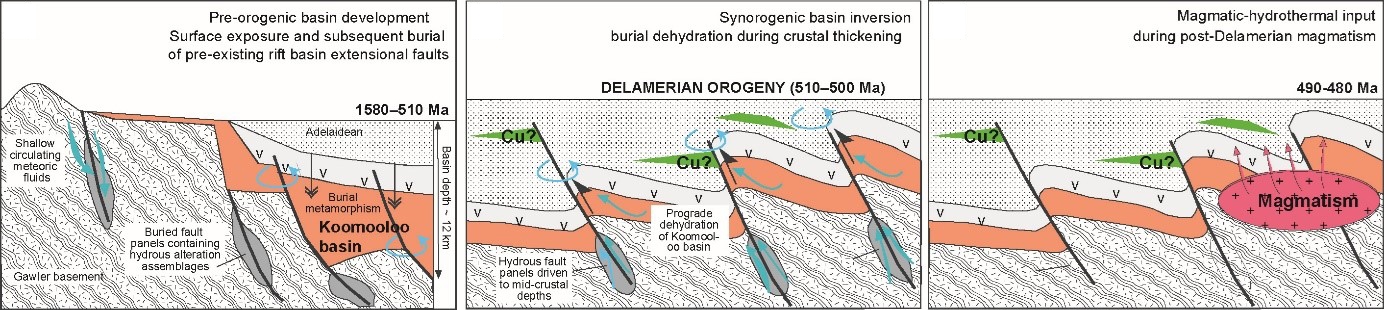
Figure 10 Cartoon evolution of rift sequences on the margin of the Gawler Craton, showing the potential for sediment-hosted base metal systems (heavily modified after Raimondo et al. 2014). A: Basin development phase; B: Compressional phase, reactivating rift structures and mobilising metals; C: Post-orogenic magmatism supplying additional metal and remobilising earlier mineralisation.
Acknowledgements
The authors are grateful for thorough and constructive reviews of this article by Chris Lewis and Josef Holzschuh from Geoscience Australia. MinEx CRC are acknowledged for facilitating the acquisition of magnetotelluric data. Many collaborators from Geoscience Australia, Geological Survey of Victoria and Geological Survey of New South Wales are thanked for stimulating discussions during the interpretation workshop in Canberra, September 2023. Stacey Curtis and Wolfgang Preiss are acknowledged for championing the proposal of the line.
References
Alias G, Sandiford M, Hand M and Worley B 2002. The P-T record of synchronous magmatism, metamorphism and deformation at Petrel Cove, southern Adelaide Fold Belt. Journal of Metamorphic Geology 20:351– 363.
Alley NF 1995. Nadda Basin. In JF Drexel and WV Preiss eds. The geology of South Australia, Volume 2, The Phanerozoic. Bulletin 54. Geological Survey of South Australia, Adelaide, pp 70–71. https://pid.sarig.sa.gov.au/document/2018d037832
Beyer SR, Kyser K, Polito PA and Fraser GL 2018. Mesoproterozoic rift sedimentation, fluid events and uranium prospectivity in the Cariewerloo Basin, Gawler Craton, South Australia. Australian Journal of Earth Sciences 65(3):409–426. https://doi.org/10.1080/08120099.2018.1439098
Brown CM and Stephenson AE 1991. Geology of the Murray Basin, Southeastern Australia. Bureau of Mineral Resources, Geology and Geophysics. Bulletin 235. Australian Government Publishing Service, Canberra.
Brown DA, Morrissey LJ, Hand M, Mulder JA, Wade B and Barrote V 2024. The metamorphic footprint of western Laurentia preserved in subducted rocks from southern Australia. Journal of Metamorphic Geology 1–37. https://doi.org/10.1111/jmg.12770
Burtt AC, Abbott P and Fanning CM 2000. Definition of Teal Flat and Marne River volcanics and associated shear zone. MESA Journal 17:37–43. Department of Primary Industries and Resources South Australia, Adelaide. https://pid.sarig.sa.gov.au/document/mesac18752
Caldwell TG, Bibby HM and Brown C 2004. The magnetotelluric phase tensor. Geophysical Journal International 158(2):457–469.
Cayley RA 2011. Exotic crustal block accretion to the eastern Gondwanaland margin in the late Cambrian - Tasmania, the Selwyn Block, and implications for the Cambrian-Silurian evolution of the Ross, Delamerian and Lachlan orogens. Gondwana Research 9:628– 648.
Cayley RA 2012. Oroclinal folding in the Lachlan Fold Belt: Consequence of SE-directed SiluroDevonian subduction rollback superimposed on an accreted arc assemblage in eastern Australia. In Selwyn Symposium 2012. Geological Society of Australia Abstracts 103:34–43.
Cayley R 2015. The Giant Lachlan Orocline – a powerful new predictive tool for mineral exploration under cover across Eastern Australia. AIG Bulletin 62:29–38.
Cayley RA, Korsch RJ, Moore DH, Costelloe RD, Nakamura A, Willman CE, Rawling TJ, Morand VJ, Skladzien PB and O’Shea PJ 2006. Crustal architecture of central Victoria: results from the 2006 deep crustal reflection seismic survey. Australian Journal of Earth Sciences 58(2):113–156.
Cayley RA, Korsch RJ, Kennett B, Skladzien BP, Jones L, Morand VJ, Gibson GM, Rawling TJ and Betts PG 2011. Results of deep seismic reflection imaging of the eastern Delamerian Orogen, South Australia and western Victoria, Australia. Data CD, version: 4th March 2011. Geoscience Victoria, Department of Primary Industries.
Chen YD, O’Reilly SY, Kinny PD and Griffin WL 1994. Dating lower crust and upper mantle events: an ion microprobe study of xenoliths from kimberlitic pipes, South Australia. Lithos 32:77–94.
Clowes RM 2010. Initiation, development, and benefits of Lithoprobe - shaping the direction of Earth science research in Canada and beyond. Canadian Journal of Earth Sciences 47(4):291–314.
Counts JW 2017. The Adelaide Rift Complex in the Flinders Ranges: Geologic history, past investigations and relevant analogues. Report Book 2017/00016. Department of the Premier and Cabinet, Adelaide, South Australia. https://pid.sarig.sa.gov.au/document/d20011689
Dentith M, Yuan H, Johnson S, Murdie R and Pina-Varas P 2018. Application of deep-penetrating geophysical methods to mineral exploration: Examples from Western Australia. Geophysics 83(3):29–41.
Depth to Crystalline Basement Data Package (2018). Geological Survey of South Australia. Department for Energy and Mining, South Australia. https://pid.sarig. sa.gov.au/dataset/mesac24568
Doublier M, Clark A, Korsch RJ, Miller R, Gilmore P, Folkes C, Mahoney L, Abdullah R, Cayley R, Cheng Y, Fraser G, Jiang W, Krapf C, McLean M, Mole D, Nicoll M, Skladzien P, Thiel S, Wade C, Wise T, Rasheed H, Hossain M and Costelloe R 2024. Crustal architecture along seismic line 22GA-CD2 new insights from the Darling-Curnamona-Delamerian deep seismic reflection survey. Geoscience Australia, Canberra. https://dx.doi.org/10.26186/149658
Doublier MP, Dutch RA, Clark D, Pawley MJ, Fraser GL, Wise TW, Kennett BLN, Reid AJ, Spaggiari CV, Calvert AJ, van der Wielen S, Dulfer H, Bendall BR, Thiel S and Holzschuh J 2015. Interpretation of the western Gawler Craton section of seismic line 13GA-EG1. In RA Dutch, MJ Pawley and TW Wise eds. What lies beneath the western Gawler Craton? 13GAEG1E Seismic and Magnetotelluric Workshop 2015. Department of State Development, South Australia, Adelaide, pp. 28–40. https://pid.sarig.sa.gov.au/document/d20011048
Drummond B, Lyons P, Goleby B and Jones L 2006. Constraining models of the tectonic setting of the giant Olympic Dam iron oxide-copper-gold deposit, South Australia, using deep seismic reflection data. Tectonophysics 420:91–103.
Flöttmann T and James P 1997. Influence of basin architecture on the style of inversion and fold-thrust belt tectonics – the southern Adelaide Fold-Thrust Belt, South Australia. Journal of Structural Geology 19:1093–1110. https://doi.org/10.1016/S0191-8141(97)00033-3
Flöttmann T, Haines P, Jago J, James P, Belperio A and Gum J 1998. Formation and reactivation of the Cambrian Kanmantoo Trough, SE Australia: implications for early Palaeozoic tectonics at eastern Gondwana’s plate margin. Journal of the Geological Society 155(3):525–539.
Foden J, Elburg MA, Turner S, Sandiford M, O’Callaghan J and Mitchell S 2002. Granite production in the Delamerian orogen, South Australia. Journal of the Geological Society 159:557–575.
Foden J, Elburg MA, Dougherty-Page J and Burtt A 2006. The timing and duration of the Delamerian orogeny: Correlation with the Ross orogen and implications for Gondwana assembly. The Journal of Geology 114:189–210.
Foden J, Elburg M, Turner S, Clark C, Blades ML, Cox G, Collins AS, Wolff K and George C 2020. Cambro- Ordovician magmatism in the Delamerian orogeny: Implications for tectonic development of the southern Gondwanan margin. Gondwana Research 81:490– 521.
Fraser G, McAvaney S, Neumann N, Szpunar M and Reid A 2010. Discovery of early Mesoarchean crust in the eastern Gawler Craton, South Australia. Precambrian Research 179:1–21.
Geoscience Australia 2023. L213 Darling-Curnamona- Delamerian (DCD) 2D Seismic Survey. Geoscience Australia, Canberra. https://pid.geoscience.gov.au/dataset/ga/147423
Gibson G, Drummond B, Fomin T, Owen A, Maidment D, Gibson D, Peljo M and Wake-Dyster K 1998. Re-evaluation of Crustal Structure of the Broken Hill Inlier through Structural Mapping and Seismic Profiling. Australian Geological Survey Organisation Record1998/11.
Gibson GM, Totterdell JM, White LT, Mitchell CH, Stacey AR, Morse MP and Whitaker A 2013. Pre-existing basement structure and its influence on continental rifting and fracture zone development along Australia’s southern rifted margin. Journal of the Geological Society 170(3):365–377.
Goleby BR, Shaw RD, Wright C, Kennett BL and Lambeck K 1989. Geophysical evidence for ’thick-skinned’ crustal deformation in central Australia. Nature 337(6205):325–330.
Haines PW, Jago JB and Gum JC 2001. Turbidite deposition in the Cambrian Kanmantoo Group, South Australia. Australian Journal of Earth Sciences 48:465–478.
Haines PW, Turner SP, Foden JD and Jago JB 2009. Isotopic and geochemical characterisation of the Cambrian Kanmantoo Group, South Australia: Implications for stratigraphy and provenance. Australian Journal of Earth Sciences 56(8):1095– 1110.
Heinson G, Didana Y, Soeffky P, Thiel S and Wise T 2018. The crustal geophysical signature of a world-class mineral system. Scientific Reports 8(1).
Hitzman MW, Selley D and Bull S 2010. Formation of Sedimentary Rock-Hosted Stratiform Copper Deposits through Earth History. Economic Geology 105(3):627– 639. https://doi.org/10.2113/gsecongeo.105.3.627
Hou B and Petts A 2021. Delamerian National Drilling Initiative: stratigraphy of Murray Basin cover sediments. MESA Journal 94:48–65. Department for Energy and Mining, South Australia, Adelaide. https://pid.sarig. sa.gov.au/document/mesac29526
Jagodzinski EA, Reid AJ, Crowley JL, Wade CE and Curtis SO 2023. Precise zircon U-Pb dating of the Mesoproterozoic Gawler large igneous province, South Australia. Results in Geochemistry 10(100020).
Jagodzinski EA, Szpunar M, Meaney K and Fraser G 2020. SHRIMP U-Pb dating of the Barossa Complex, South Australia: exploring tectonic links between the Gawler Craton and Curnamona Province. Report Book 2020/00017. Department for Energy and Mining, South Australia, Adelaide. https://pid.sarig.sa.gov.au/document/2020d032924
Jagodzinski EA, Wade CE, Pawley MJ, Wise TW, Werner M and Petts A 2024. Delamerian National Drilling Initiative: basement rocks to the Murray Basin, South Australia. Report Book 2024/00009. Department for Energy and Mining, South Australia, Adelaide. https:// pid.sarig.sa.gov.au/document/2024d149876
Kay B, Heinson G and Boren G 2024. Multiscale resistivity mapping from an intracontinental hydrothermal mineral system, Adelaide Rift Complex, Australia. Gondwana Research 129:292–304.
Kennett B and Saygin E 2015. The nature of the Moho in Australia from reflection profiling: A review. Geophysical Research Letters 5:7491.
Kennett B, Saygin E, Fomin T and Blewett R 2016. Deep Crustal Seismic Reflection Profiling: Australia, 1978–2015. ANU Press and Geoscience Australia, Canberra.
Korsch R and Doublier M 2015. Major crustal boundaries of Australia, and their significance in mineral systems targeting. Ore Geology Reviews 76:211–228.
Korsch RJ, Preiss WV, Blewett RS, Cowley WM, Neumann NL, Fabris AJ, Fraser GL, Dutch R, Fomin T, Holzschuh J, Fricke CE, Reid AJ, Carr LK and Bendall BR 2010. Deep seismic reflection transect from the western Eyre Peninsula in South Australia to the Darling Basin in New South Wales: geodynamic implications. In RJ Korsch, N Kositcin eds. South Australian Seismic and MT Workshop, Extended Abstracts. Geoscience Australia, pp. 105–116 (Record. 2010/10).
Lloyd JC, Blades ML, Counts JW, Collins AS, Amos KJ, Wade BP, Hall JW, Hore S, Ball AL, Shahin S and Drabsch M 2020. Neoproterozoic geochronology and provenance of the Adelaide Superbasin. Precambrian Research 350:105849. https://doi:10.1016/j.precamres.2020.105849
Lloyd JC, Collins AS, Blades ML, Gilbert SE and Amos KJ 2022. Early Evolution of the Adelaide Superbasin. Geosciences 12:154. https://doi.org/10.3390/geosciences12040154
Mandal B, Vijaya Rao V, Sarkar D, Bhaskar Rao YJ, Raju S, Karuppannan P and Sen MK 2018. Deep crustal seismic reflection images from the Dharwar craton, Southern India—evidence for the Neoarchean subduction. Geophysysical Journal International 212:777–794.
Marshak S and Flöttmann T 1996. Structure and origin of the Fleurieu and Nackara Arcs in the Adelaide fold-thrust belt, South Australia: salient and recess development in the Delamerian Orogen. Journal of Structural Geology 18:891–908.
McCuaig TC and Hronsky JMA 2014. The mineral system concept: the key to exploration targeting. Special Publication of the Society of Economic Geologists 18:153–175.
McGowran B and Li Q 1997. Stratigraphic excursion to Maslin and Aldinga Bays. Marine Geology ’97 Field Guide. The University of Adelaide, South Australia (unpublished).
Mills KJ and David V 2004. The Koonenberry Deep Seismic Reflection Line and Geological Modelling of the Koonenberry Region, western New South Wales, 55 pp plus section. Geological Survey of New South Wales, Sydney. (Unpublished Open File Report GS2004/185).
Minty BRS and Poudjom Djomani Y 2019. Total Magnetic Intensity (TMI) Grid of Australia 2019 - seventh edition - 40 m cell size: Geoscience Australia, Canberra.
Morrissey LJ, Barovich KM, Hand M, Howard KE and Payne JL 2019. Magmatism and metamorphism at ca. 1.45 Ga in the northern Gawler Craton: The Australian record of rifting within Nuna (Columbia). Geoscience Frontiers 10(1):175–194. https://doi.org/10.1016/j.gsf.2018.07.006
Morrissey LJ, Hand M, Wade BP and Szpunar M 2013. Early Mesoproterozoic metamorphism in the Barossa Complex, South Australia: links with the eastern margin of Proterozoic Australia. Australian Journal of Earth Sciences 60:1–27.
Mountford H, Love D and Sinadinovski C 1997. The Burra Ml5.1 earthquake. In R Boyce, B Lynam, S Jaume and B Butler eds. Cuthbertson earthquakes in Australian cities – can we ignore the risks? Proceedings of the Australian Earthquake Engineering Society Seminar. Australian Earthquake Engineering Society, Paper No. 4.
Mulder JA, Halpin JA and Daczko NR 2015. Mesoproterozoic Tasmania: Witness to the East Antarctica–Laurentia connection within Nuna. Geology 43:759–762. https://doi:10.1130/G36850.1
Myers JS, Shaw RD and Tyler IM 1996. Tectonic evolution of Proterozoic Australia. Tectonics 15:1431–1446.
Naina 2024. Missing pieces in the deformation and thermal history along the Cambro-Ordovician Delamerian Orogen, South Australia: Revelation of 100My of post-Delamerian tectonic history through 40Ar/39Ar geochronology. PhD Thesis. Australian National University.
Offler R and Fleming P 1968. A synthesis of folding and metamorphism in the Mt. Lofty Ranges, South Australia. Journal of the Geological Society of Australia 15:245–266.
Page RW, Conor CHH, Stevens BPJ, Gibson GM, Preiss WV and Southgate PN 2005. Correlation of Olary and Broken Hill Domains, Curnamona Province: Possible Relationship to Mount Isa and Other North Australian Pb-Zn-Ag-Bearing Successions. Economic Geology 100(4):663–676.
Payne JL, Hand M, Barovich K, Reid AJ and Evans DAD 2009. Correlations and reconstruction models for the 2500–1500 Ma evolution of the Mawson Continent. In SM Reddy, R Mazumder, DAD Evans, AS Collins eds. Palaeoproterozoic Supercontinents and Global Evolution. Geological Society Special Publications London, UK. 323:319–355.
Powell CMcA, Preiss WV, Gatehouse CG, Krapez B and Li ZX 1994. South Australian record of a Rodinian epicontinental basin and its mid-Neoproterozoic breakup (~700 Ma) to form the Palaeo-pacific Ocean. Tectonophysics 237:113–140.
Preiss WV 1987. The Adelaide Geosyncline: Late Proterozoic Stratigraphy, Sedimentation, Palaeontology and Tectonics. Bulletin 53. Geological Survey of South Australia, Adelaide. https://pid.sarig.sa.gov.au/document/2018d037830
Preiss WV 2000. The Adelaide Geosyncline of South Australia, and its significance in continental reconstruction. Precambrian Research 100:21–63.
Preiss WV, Drexel JF and Reid AJ 2009. Definition and age of the Kooringa Member of the Skillogalee Dolomite: host for Neoproterozoic (c. 790 Ma) porphyry-related copper mineralisation at Burra. MESA Journal 55:19–33. Department of Primary Industries and Resources South Australia. https://pid.sarig.sa.gov.au/document/mesac22268
Preiss WV, Korsch RJ, Blewett RS, Fomin T, Cowley WM, Neumann NL and Meixner AJ 2010. Geological interpretation of deep seismic reflection line 09GA- CG1: the Curnamona Province-Gawler Craton Link Line, South Australia. Geoscience Australia. Record 2010/10:66-76.
Preiss WV 2019. The tectonic history of Adelaide’s scarp- forming faults. Australian Journal of Earth Sciences 66(3):411–432.
Raimondo T, Hand M and Collins WJ 2014. Compressional intracontinental orogens: Ancient and modern perspectives. Earth-Science Reviews 130:128–153.
Reid A, Forster M, Preiss W, Caruso A, Curtis S, Wise T, Vasegh D, Goswami N and Lister G 2022. Complex 40Ar/39Ar age spectra from low-grade metamorphic rocks: Resolving the input of detrital and metamorphic components in a case study from the Delamerian Orogen. Geochronology 4:471–500.
Robertson KE, Heinson GS and Thiel S 2016. Lithospheric reworking at the Proterozoic–Phanerozoic transition of Australia imaged using AusLAMP magnetotelluric data. Earth and Planetary Science Letters 452:27–35.
Robertson KE, Kirkby A, Thiel S and Duan J 2020. Delamerian AusLAMP resistivity model. https://pid. sarig.sa.gov.au/model/mesac29244
Robertson K, Taylor D, Thiel S and Heinson G 2015. Magnetotelluric evidence for serpentinisation in a Cambrian subduction zone beneath the Delamerian Orogen, southeast Australia. Gondwana Research 28(2):601–611.
Robertson KE, Heinson GS, Taylor DH and Thiel S 2017. The lithospheric transition between the Delamerian and Lachlan orogens in western Victoria: new insights from 3D magnetotelluric imaging. Australian Journal of Earth Sciences 64(3):385–399.
Rosenbaum G 2018. The Tasmanides: Phanerozoic Tectonic Evolution of Eastern Australia. Annual Review of Earth and Planetary Sciences 46:291–325.
Sandiford M, Foden J, Zhou S and Turner S 1992. Granite genesis and the mechanics of convergent orogenic belts with application to the southern Adelaide Fold Belt. Transactions of the Royal Society of Edinburgh Earth Sciences 83:83–93.
Stoian LM and Wise T 2023. New palynology results from western Murray Basin, South Australia. Report Book 2023/00001. Geological Survey Geoscience Publication. Government of South Australia. https://pid. sarig.sa.gov.au/document/2023d003842
Thiel S 2024. Delamerian-Lachlan orogen 3D resistivity models. Geological Survey Geoscience Publication. Government of South Australia. https://pid.sarig.sa.gov.au/model/mesac30546
Thornton RCN 1972. Hydrocarbon potential of western Murray Basin and infrabasins. Report Book 72/00020 South Australia Department of Mines. https://pid.sarig.sa.gov.au/document/rb7200020
Wise T 2023. The Delamerian NDI: Linking South and eastern Australia. Australian Exploration Geoscience Conference 2023: Abstract 078.
Wise TW and Thiel S 2020. Proterozoic tectonothermal processes imaged with magnetotellurics and seismic reflection in Southern Australia. Geoscience Frontiers 11:885–893.