Laszlo Katona
Geological Survey of South Australia, Department for Energy and Mining
Download this article as a PDF (30.7 MB); cite as MESA Journal 92, pages 26–37
Published July 2020
Introduction
The gravity and magnetic expressions of iron oxide – copper–gold (IOCG) deposits in the Olympic Cu–Au Province are considered primary targeting criteria when exploring for these systems. As regional data improves in quality and quantity and processing techniques evolve, the opportunity exists to increase the utility of gravity and magnetic data to further understand the geophysical characteristics of these deposits. Vectorisation of residual gravity and reduced-to-pole total magnetic intensity (RTP-TMI) data generate mappable criteria that permit quantification of anomaly gradients. The subsequent application of spatial statistics enables us to map the spatial clustering of high-magnitude anomalies. The distribution of spatial clusters provides insight into the geological terranes occupied by IOCG deposits. These insights have potential to influence site selection and subsequent exploration strategies.
This article describes the processing of geophysical grids and subsequent application of spatial statistics that result in improved geophysical images of IOCG deposits and a clearer understanding of their regional geophysical and related geological characteristics, distribution and host domains.
Gravity and TMI data in South Australia
Gravity data in South Australia’s gravity database are ground-acquired, terrain-corrected Bouguer gravity values with a correction density of 2.67 g/cm3. The database consists of regional government-acquired data with variable station spacing up to 11 km. Recent large surveys in the northern Gawler Craton and Coompana Province have station spacing between 500 and 1,000 m. This data is supplemented by company surveys at tenement scale with station spacing to sub-100 m, a portion of which were captured as gravity profiles along roads and tracks. The highly variable nature of gravity station density and distribution raises technical issues when gridding the data; the aim being to minimise gridding artefacts in areas with low station density while also minimising curvature overshoot and loss of resolution in areas with high station density (Foss et al. 2018).
Since the first attempts to interpolate a statewide gravity coverage in 2007 (Fig. 1a), the Geological Survey of South Australia has endeavoured to improve the method for gridding regional, variable density gravity data with the aim of overcoming unwanted survey boundary and station artefact effects. Early efforts were unfit for meaningful regional analysis as can be seen in Figure 1a, with subsequent versions yielding incremental improvements as shown in Figures 1b and 1c. In 2016 the supervised variable density methodology (Fig. 1d; Katona 2017) produced a statewide grid that is virtually free of gridding artefacts, supporting subsequent filtering, such as vertical gradient (1VD) or residual transformation.
TMI data in South Australia has a much more consistent spatial coverage, with the vast majority of TMI surveys being 400 m or better line spacing – company surveys can be as low as 50 m. Gridding and merging regional TMI data are straightforward due to consistent line spacing and the utility of the Australia Wide Airborne Geophysical Survey, which is used to merge and level TMI data into a continuous, statewide grid. 1VD images of TMI are routinely used for geological interpretation and exploration targeting.
Filtering of gravity and TMI data
A fundamental aim of 1VD or residual transformation of gravity and TMI data is obtaining a version of the image that lends itself to interpretation and analysis of the near surface, through the attenuation of deeper sources that can mask or swamp the high-frequency near-surface signal (Katona, Wise and Reid 2018). Residual and 1VD filters increase the emphasis of potential field variations due to shallow contrasts in the measured property and improved horizontal resolution of adjacent, overlapping features (Foss et al. 2018). For the TMI and gravity transformations discussed in this article, we are interested in maintaining the gradient values and imaging the field values. A 1VD transform optimises the imaging of shallow sources but presents difficulties in quantitative analysis or comparison of anomaly magnitudes, while the residual offers both quantitative measurement of gradients and sharpening of shallow features. This is illustrated in Figure 2, which shows the Bouguer gravity field compared with residual and 1VD of the Carrapateena deposit. Figure 3 illustrates the same concept, using the RTP-TMI field.
Figure 2 (a) Bouguer gravity field at Carrapateena, taken from the 2016 South Australian gravity grid. (b) The residual Bouguer gravity field accentuates near-surface features. (c) The 1VD of the Bouguer gravity field further accentuates the near-surface features.
Mapping IOCG deposits using residual gravity and TMI
Residuals of gravity and RTP-TMI grids were produced by subtracting 1,000 m upward continuation grids of the Bouguer gravity and RTP-TMI from Bouguer gravity and RTP-TMI grids (Katona, Wise and Reid 2018). As illustrated in Figures 2 and 3, the residuals provide a sharper representation of near-surface features and, for IOCG deposits in the Olympic Cu–Au Province, are taken to be the geophysical expression of iron-rich mineralisation. Figure 4 displays the residual gravity and TMI expression of six IOCG deposits within the Olympic Cu–Au Province.
Vectorising gravity and TMI data
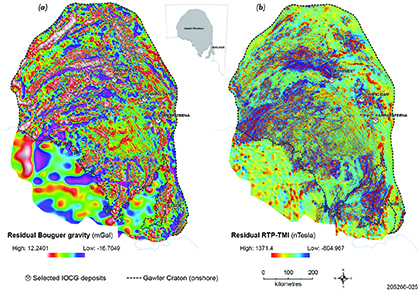
Residual Bouguer gravity and RTP-TMI grids of the Gawler Craton are shown in Figure 5. Vectorisation of a potential field grid was based upon a two-stage process of contouring each grid and then selecting positive anomalies with an upper limit set on the length of the anomaly perimeter (Katona, Wise and Reid 2018). Once anomalies of grids were vectorised, descriptive statistics were captured as attributes from the portion of the grid covered by each anomaly polygon. Anomaly magnitude was calculated by subtracting the anomaly perimeter value from the anomaly maximum. A geoprocessing script performed the required steps. The Gawler Craton’s populations of gravity and TMI anomaly polygons can be used as an aid for interpretation, as inputs in GIS overlay operations, as mappable criteria in mineral potential modelling or for analysis using spatial statistics.
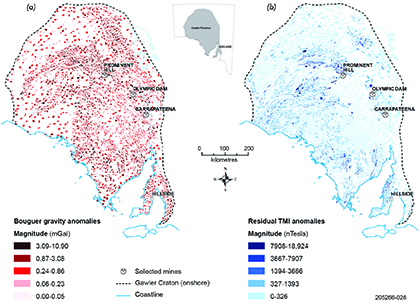
Figure 6 shows the result of geoprocessing scripts used to identify gravity and RTP-TMI anomalies within a spatial separation no greater than 1,000 m. Removing non-coincident anomalies reduces the IOCG search space from 10,259 gravity and 39,047 magnetic features to 8,510 gravity and 20,345 magnetic features. The anomaly polygons in Figure 6 are coloured according to the magnitude of the feature, with darker shades representing higher magnitude features. A spatial overlay analysis of known IOCG occurrences in the Olympic Cu–Au Province indicates 62.5% are within high-magnetic features, 51.9% are within high-gravity features, but 96.2% are within 1,000 m of a magnetic anomaly that has an associated gravity anomaly (within 1,000 m). Based on these statistics, coincident magnetic and gravity features within 1,000 m of each other is deemed a robust signature of most IOCG deposits.
Figure 5 Residual Bouguer gravity (a) and residual RTP-TMI (b) grids clipped to the Gawler Craton boundary as inputs into the vectorisation process.
Spatial clustering of gravity and RTP-TMI in the Gawler Craton
Within the context of exploration for IOCG mineralisation, the distribution of high-magnitude gravity anomalies and, to a lesser degree RTP-TMI anomalies, is of interest. High-magnitude gravity anomalies characterise almost every IOCG deposit in South Australia. High-magnitude TMI anomalies characterise all South Australian iron deposits and moderate-magnitude TMI anomalies are typically present at sites with significant IOCG mineralisation (Fig. 4).
A spatial statistics tool for analysing spatial patterns, the Getis Ord General G, was applied to the gravity and TMI anomaly datasets to test if there was evidence of spatial clustering of gravity and TMI anomalism. The analysis indicated that within the populations of anomalies of the Gawler Craton there is <1% likelihood that clustering of high-magnitude gravity and magnetic anomalies is the result of random chance (Katona and Fabris 2020). In the context of analysis of gravity and magnetic anomalism, this means spatial distribution of anomalism is demonstrably controlled by geological processes and we can confidently map anomaly clusters and spatial outliers and interpret them in the context of their potential to relate to IOCG deposits.
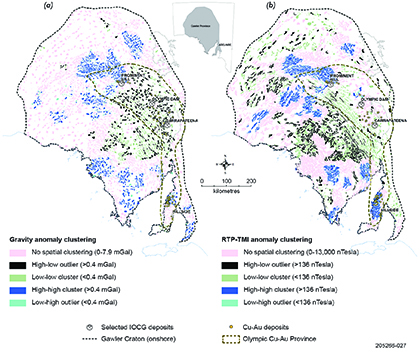
The tool for mapping spatial clustering is the Anselin Local Morans I (Anselin 1995), found in the ArcGISTM software package. In addition to mapping clusters and outliers, it sets a threshold for high-magnitude gravity and magnetic anomalies which, in the case of gravity anomalies, helps in further reducing the IOCG search space. For the residual gravity and TMI grids used in this analysis, the threshold is 0.4 mGals for a high-magnitude gravity feature and 136 n Teslas for a high-magnitude TMI feature. Figure 7 shows the clusters and outliers for residual gravity and RTP-TMI anomalies throughout the Gawler Craton. There are five distinct classes of clustering:
- high-magnitude clusters (high-high cluster), a high-magnitude anomaly in close proximity to another high-magnitude anomaly
- high magnitude outliers (high-low outlier), a high-magnitude anomaly among low-magnitude anomalies
- low clusters (low-low cluster), a low-magnitude anomaly in close proximity to other low-magnitude anomalies
- low outliers (low-high outlier), a low-magnitude anomaly among high-magnitude anomalies
- no spatial clustering, an area which does not exhibit the clustering characteristics of the other classes and occurs in-between zones of clustering.
Figure 7 Gravity (a) and RTP-TMI (b) clusters of the Gawler Craton. The statistically derived gravity threshold for a high-magnitude residual gravity feature is 0.4 mGals and for a high-magnitude residual magnetic feature is 136 nTeslas. The Olympic Cu–Au Province is shown and encapsulates most of the known IOCG mines, deposits and occurrences.
The images in Figure 7 show broad agreement in the locations of high clusters throughout the Gawler Craton, indicating zones with high-density clusters (dark blue) have a similar distribution of high-magnetic clusters. The high outliers (black) within the gravity image are located within and adjacent to the central part of the Olympic Cu–Au Province and extend to the southwest across the Gawler Ranges Volcanic Province. Within the Olympic Cu–Au Province, the magnetic features that correspond with these gravity outlier features are either low clusters or have no clustering. Where the gravity high outliers extend across the Gawler Range Volcanic Province, the magnetic features are also high outliers, broadly matching the extent of these gravity features.
Locations of IOCG deposits and occurrences relative to gravity and TMI clusters
There are around 100 named IOCG deposits and occurrences in and around the Olympic Cu–Au Province distributed across three distinct regions (Fig. 7). In the north, deposits are clustered near the southeastern edge of the Mount Woods Inlier and are situated over high-magnitude clusters of gravity and TMI anomalies. In the central region, high-magnitude gravity outliers are the sites of a number of world-class IOCG deposits including Olympic Dam and Carrapateena along with a number of significant occurrences currently being investigated. These deposits overlie mainly non-clustered magnetic anomalies. In the south, clusters of deposits and occurrences are found in the Moonta Subdomain, mainly associated with clusters of high-magnitude gravity and magnetic anomalies.
Discussion
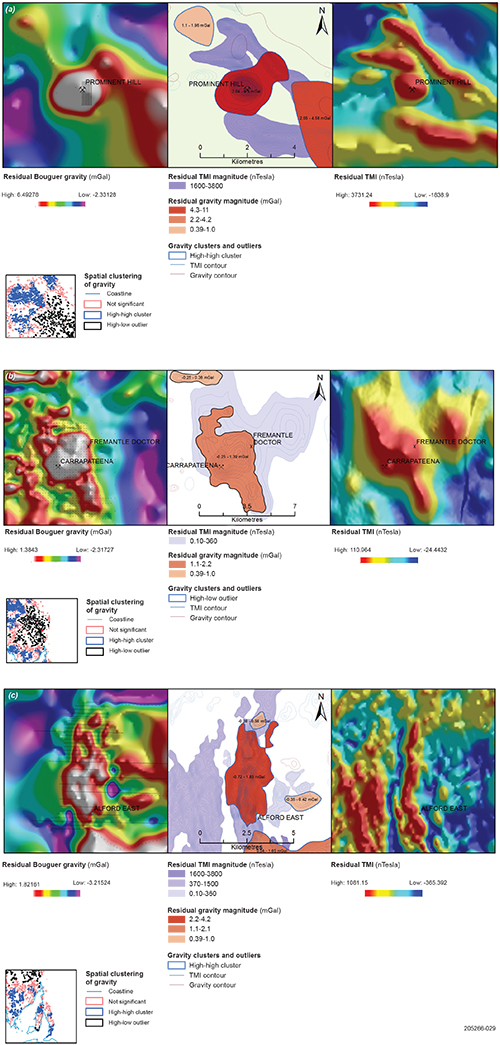
The Olympic Cu–Au Province is a metallogenic province, the extent of which was defined using a combination of borehole, geophysical and deposit location data (Skirrow et al. 2002; Skirrow et al. 2007; Reid 2019). The northeastern portion of the province that intersects the Mount Woods domain is characterised by deformed, relatively shallow (<150 m) high-metamorphic grade rocks of the Mount Woods Inlier, and Coober Pedy and Mabel Creek ridges (Tiddy et al. 2020), with hydrothermal iron oxide interpreted to have formed at higher temperatures and deeper in the crust than IOCG deposits of the central Olympic Cu–Au Province (Clarke et al. 2014). These deposits represent a spectrum from those with significant copper (eg Manxman A1) to those that are relatively copper-poor (eg Cairn Hill). This region of the Olympic Cu–Au Province manifests geophysically as predominantly high-magnitude gravity and spatially coincident high-magnitude TMI clusters due to the prevalence of magnetic, dense and shallow iron-rich rocks. Although associated with upper crustal, mostly undeformed rocks, Prominent Hill and a number of other identified occurrences along the southern margin of the Mount Woods Inlier are similarly characterised as being part of the high-cluster domain.
In the central portion of the Olympic Cu–Au Province, IOCG deposits are primarily hematite-dominant, hosted in felsic intrusive rocks of the Donington and Hiltaba suites (Flint 1993; Ferris, Schwarz and Heithersay 2002; Schwarz 2003) or low-metamorphic grade metasedimentary rocks of the Wallaroo Group (Cowley, Connor and Zang 2003), all of which have a relatively low background magnetite content. The low-density felsic intrusives which contain hydrothermally derived iron oxides form clear gravity outliers with low or moderate TMI responses. These gravity outliers form the most endowed part of the Olympic Cu–Au Province and 23 out of the 28 basement-hosted Cu–Au deposits are coincident with high-magnitude gravity outliers. Possible alternative explanations for high-magnitude gravity outliers include mafic intrusive units and the development of skarn, which are both known in the region and occur in close proximity to IOCG deposits (Katona and Fabris 2020). The high-magnitude gravity outliers characteristic of IOCG deposits in the central Olympic Cu–Au Province also spread across the Gawler Range Volcanics Province, allowing the possibility of a similar relationship between the geology and gravity response, and potentially extending the area of prospectivity. By and large, these gravity outliers are coincident with TMI anomalies of a similar magnitude to those found in the central part of the Olympic Cu–Au Province. Isolated mafic volcanic units within the volcanic pile provide an alternative source of gravity and magnetic features to IOCG deposits. However, limited IOCG exploration has taken place across the Gawler Range Volcanic Province largely due to the variable thickness of upper Gawler Range Volcanics. Nevertheless, the results from this analysis indicate that there are many coincident gravity and TMI features that warrant closer investigation (Katona and Fabris 2018).
The Moonta Domain occupies the southernmost part of the Olympic Cu–Au Province and is dominated by high-magnitude clusters of gravity and TMI. Although only 17 of the 58 Cu–Au deposits are located directly over a gravity anomaly, 42 are in close proximity with gravity high clusters, indicating some spatial association with high-density sources (Katona and Fabris 2018). The remaining 16 deposits are associated with gravity features in the no-spatial-clustering class. Explanations for this less significant correlation between known occurrences and isolated gravity and magnetic features include the occurrence of iron oxide related to upper greenschist to amphibolite facies metamorphism (Conor et al. 2010), the spatial control structures and shear zones have on metasomatic iron in the Moonta Domain, and effects of weathering in the region.
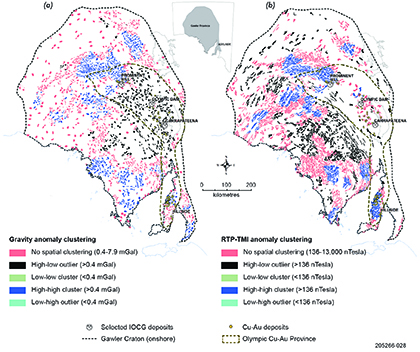
The areas classified as no spatial clustering that lie between high-magnitude clusters and high-magnitude outliers may represent gradational areas in the potential field response between the high clusters and high outliers. Figure 8 displays the cluster types with all anomalies below the high-magnitude threshold removed and shows significant numbers of above-threshold anomalies adjacent to high clusters and high outliers. This class of anomalies are too close together to be high outliers and too far apart to be part of a high cluster, but are above the threshold for a high-magnitude anomaly and are therefore considered prospective. These additional high-magnitude features offer additional potential targets of interest for exploration targeting.
Figure 8 Residual gravity (a) and TMI (b) anomaly clusters displaying only those anomalies greater than the statistical threshold derived by the cluster and outlier analysis. The pink anomalies display no spatial clustering and where they occupy the regions between high-magnitude clusters and high-magnitude outliers are interpreted to be gradational boundaries between changing geological terranes.
Geophysical signatures of IOCG deposits: incorporating anomaly clusters
Figure 9 displays three IOCG deposits and occurrences within the context of anomaly cluster polygons and provides an example of each of the three geological terranes discussed previously. The vectorised geophysical data provides improvements upon interpretation of the images alone, by capturing anomaly magnitude and clustering type while showing the spatial coincidence between overlapping gravity and TMI anomalies. Anomaly contours provide additional detail within the anomaly regions enabling the visualisation of potential field perturbations within individual anomalies.
Figure 9 Residual gravity and residual RTP-TMI images of the Olympic Cu–Au Province displayed with the results of cluster and outlier analysis. (a) Prominent Hill deposit, northern region. (b) Carrapateena deposit, central region. (c) Alford East occurrence, southern region. The boundary of the gravity clusters shows the cluster classification, the internal colour indicates the anomaly magnitude (also labelled) and the contours show the internal detail of the anomalies. These improvements aim to provide information not expressed in the images alone.
Conclusion
IOCG deposits of the Olympic Cu–Au Province are commonly associated with semi-coincident gravity and magnetic anomalies; however, there are thousands of individual geophysical features in the region, many of which do not relate to a mineral deposit. The classification of anomalies by magnitude and spatial clustering type helps to identify those that are more likely to relate to mineralisation and significantly narrows the search space.
In addition, spatial clustering of gravity and TMI anomalies highlight domains of similar geophysical character within the Olympic Cu–Au Province and provide the basis for applying specific exploration criteria in each distinct domain. This process has identified a large number of unexplored, high-magnitude gravity anomalies with coincident TMI features that remain to be tested by drilling.
Gravity and magnetic high outliers, a characteristic of many deposits within the central Olympic Cu–Au Province, are also evident within the adjacent Gawler Range Volcanic region and warrant further investigation.
Also, non-clustered high-magnitude anomalies present in the regions between high clusters (eg Mount Woods Inlier) and high outliers (central Olympic Cu–Au Province) are considered to be prospective.
Data availability
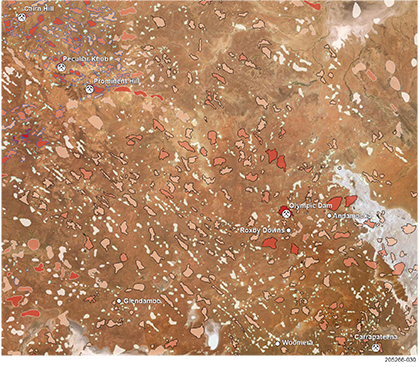
Gravity and TMI anomaly polygons generated by the vectorisation of residual grids are now accessible through the South Australian Resources Information Gateway (SARIG; Fig. 10). Click on ‘All Map Layers’ in the lower left-hand-side of the screen and type ‘Prospectivity Modelling’ in the input box. Polygon boundaries are classified by their cluster type, while the polygon fill is classified by anomaly magnitude, with darker colours indicating higher magnitude anomalies. Contours for each anomaly are also available to complete the datasets and provide internal detail. Each of the four main layers (gravity anomalies, gravity contours, TMI anomalies, TMI contours) can be downloaded separately or all of the data layers can be downloaded as a package by following the layer’s metadata link.
Acknowledgements
Adrian Fabris and Anthony Reid of the Geological Survey of South Australia are acknowledged for their valuable geological insights and input in reviewing this paper.
References
Anselin L 1995. Local indicators of spatial association – LISA. Geographical Analysis 27(2):93–115.
Clarke JM, Cook NJ, Ciobanu CL, Reid AJ and Hill P 2014. Defining the style of mineralisation at the Cairn Hill magnetite-sulphide deposit; Mount Woods Inlier, Gawler Craton, South Australia. Gold14@Kalgoorlie, International Symposium, Kalgoorlie, Western Australia, 2014, Extended Abstracts, pp. 19–20.
Conor C, Raymond O, Baker T, Teale G, Say P and Lowe G 2010. Alteration and mineralisation in the Moonta-Wallaroo copper-gold mining field region, Olympic Domain, South Australia. In TM Porter ed., Hydrothermal iron oxide copper-gold and related deposits: a global perspective, v. 3 - Advances in the understanding of IOCG deposits. PGC Publishing, Adelaide, pp. 147–170.
Ferris GM, Schwarz MP and Heithersay P 2002. The geological framework, distribution and controls of Fe-oxide Cu-Au mineralisation in the Gawler Craton, South Australia. Part I – Geological and tectonic framework. In TM Porter ed., Hydrothermal iron oxide copper-gold and related deposits: a global perspective, vol. 2. PGC Publishing, Adelaide, pp. 9–31.
Katona LF and Fabris A 2020. Defining geophysical signatures of IOCG deposits. In L Corriveau, AH Mumin and EG Potter eds Iron oxide copper-gold (Ag-Bi-Co-U-REE) and affiliated deposits, Special Paper 52. Geological Association of Canada.
Skirrow RG, Bastrakov EN, Barovich K, Fraser GL, Creaser RA, Fanning CM, Raymond OL and Davidson GJ 2007. Timing of iron oxide Cu-Au-(U) hydrothermal activity and Nd Isotope constraints on metal sources in the Gawler Craton, South Australia. Economic Geology 102(8):1441–1470.
Skirrow RG, Bastrakov, E, Davidson G, Raymond OL and Heithersay P 2002. The geological framework, distribution and controls of Fe-oxide and related alteration, and Cu-Au mineralisation in the Gawler Craton, South Australia. Part II – Alteration and mineralisation. In TM Porter ed., Hydrothermal iron oxide copper-gold and related deposits: a global perspective, vol. 2. PGC Publishing, Adelaide, pp. 33–47.
Tiddy CJ, Betts PG, Neumann MR, Murphy FC, Stewart J, Giles D, Sawyer M, Freeman H and Jourdan F in press. Interpretation of a ca. 1600–1580 Ma metamorphic core complex in the northern Gawler Craton, Australia. Gondwana Research. https://doi.org/10.1016/j.gr.2020.04.008


