
Regulation of the salt field and enquiries
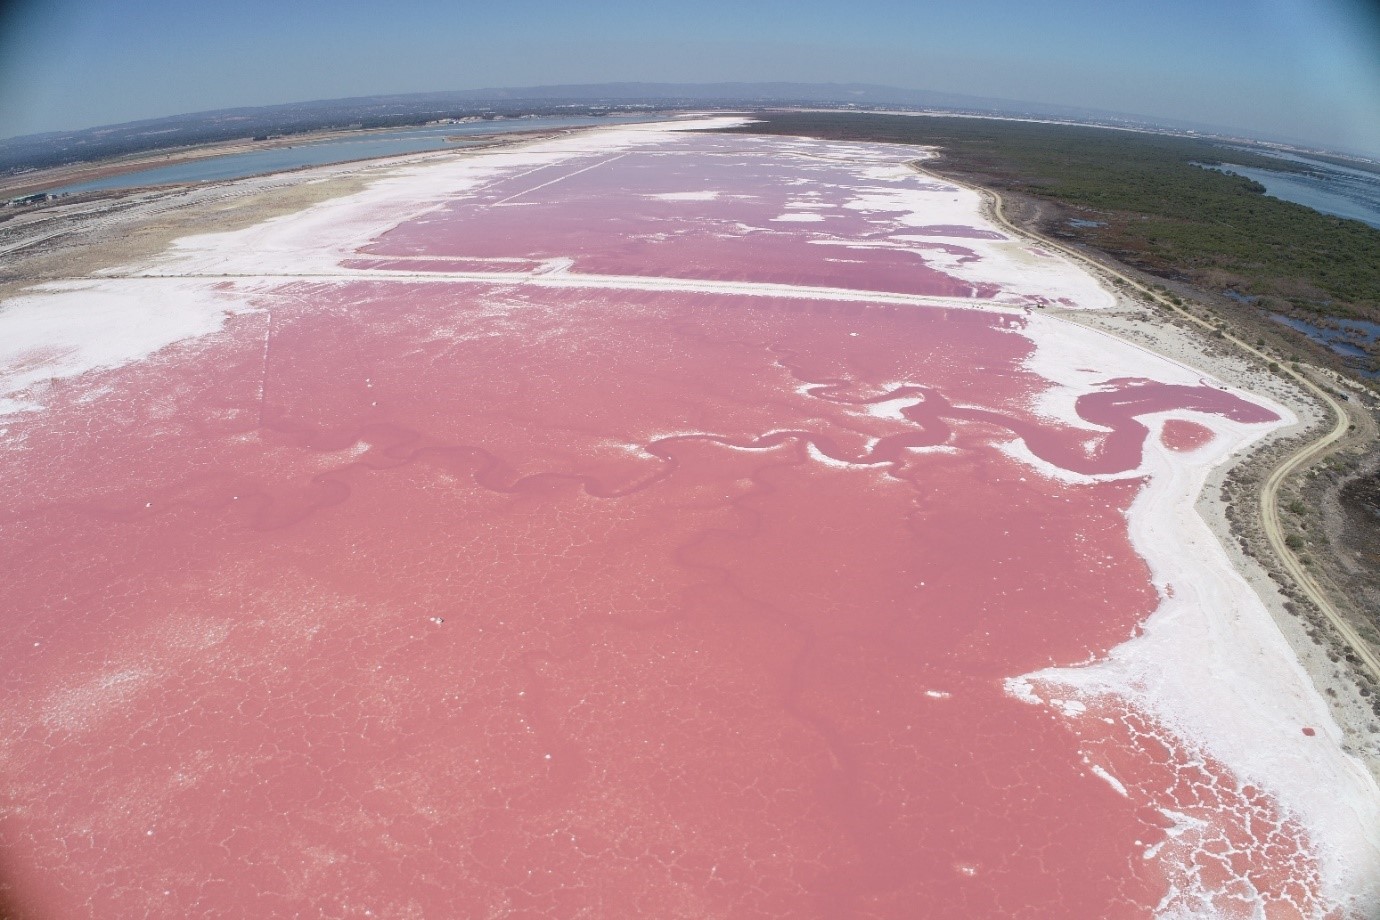
The Dry Creek Salt Field is an area of evaporation ponds stretching more than 30 km along the coast from Dry Creek to Middle Beach.
Several South Australian Government agencies are involved with the regulation of the salt field. Listed below are the relevant government agency websites to visit depending on the nature of your query.
For enquiries about:
- The lead regulator for operations at the salt field, stay on this webpage
- Mangroves and other vegetation, visit the Department for Environment and Water website
- The regulation of discharges to marine or inland waters associated with salt production, visit the Environment Protection Authority website
Updates on Dry Creek salt field
30 June 2025: Revised and updated PEPR
DEM has approved a revised Program for Environment Protection and Rehabilitation (PEPR) for the Dry Creek Salt Field, which authorises the resumption of commercial salt production, progresses long term closure planning strategies for the site and provides improvements to existing monitoring requirements to minimise risks to offsite impacts.
The updated PEPR describes:
- Re-commencement of commercial salt production.
- Construction and operation of a brine pipeline to bypass section 2 of the salt field, South of St Kilda.
- Progressive rehabilitation and closure planning for the salt field, including the early preparation of land in section 1 at Dry Creek for future development and housing.
- Improvements to existing monitoring and closure requirements.
Before commercial salt production can resume, Buckland Dry Creek Pty Ltd will construct a 6km long brine bypass pipeline. The bypass pipeline is intended to protect and assist recovery of previously impacted mangroves adjacent to Section 2 of the salt field, south of St Kilda.
The PEPR is subject to conditions, which require BDC to:
- Provide DEM with Standard Operating Procedures for operation of the salt field prior to commencement of commercial salt operations, that address the achievement of environmental outcomes for salt field operations and maintenance works as outlined in the PEPR.
- Provide DEM with bypass pipeline plans and designs that meet the relevant Australian standards and have been certified by a suitably qualified registered professional engineer prior to both construction and commissioning.
- Develop and execute an agreement with SA Water to maintain access to the Bolivar outfall channel as a contingency measure prior to commissioning of the brine bypass pipeline.
The approved PEPR was assessed by DEM in collaboration with other government agencies. Any enquiries in relation to this approval can be directed to dem.miningregrehab@sa.gov.au.
25 June 2025: St Kilda groundwater monitoring update
St Kilda groundwater monitoring network
A monitoring network of six groundwater testing wells, commissioned by the Department for Energy and Mining (DEM) and City of Salisbury, was installed in 2022 on public land in the St Kilda township to provide a better understanding of the salinity and depth to groundwater in that area over time. Well locations are shown in the map below.
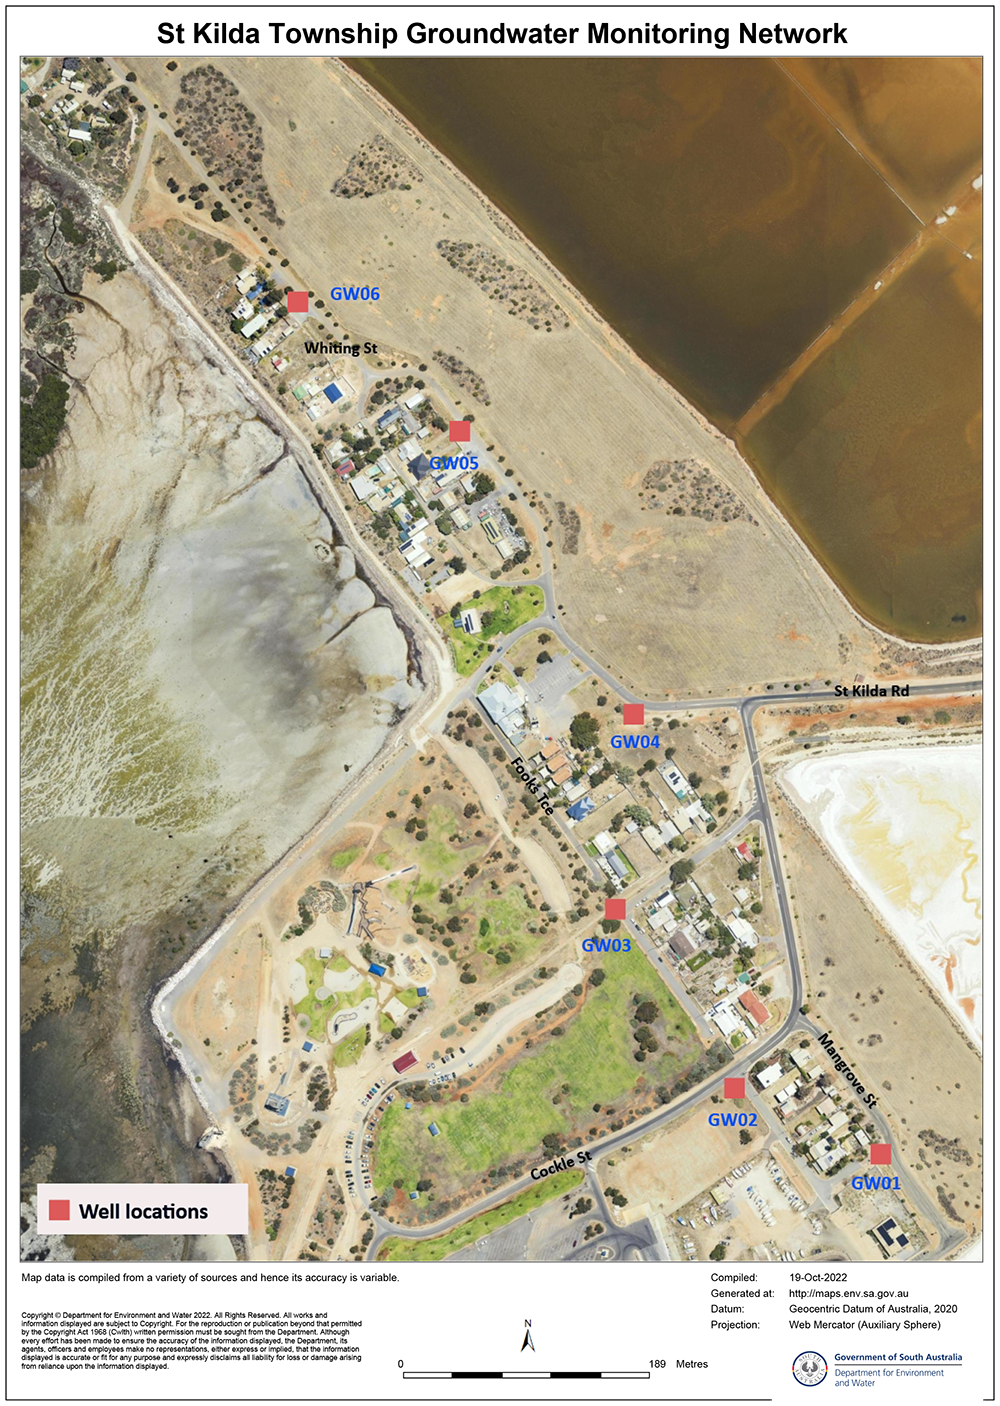
Download a copy of the map: St Kilda township groundwater monitoring network with well locations (PDF, 1.4 MB)(PDF)


Previous updates
DEM has received a revised and updated program for environment protection and rehabilitation (PEPR) for the operation of the Dry Creek Salt Fields which seeks to authorise the re-commencement of commercial salt production.
The updated PEPR is currently under assessment and includes:
- Re-commencement of commercial salt production, proposing to move on from the 'holding pattern' status of the PEPR currently approved.
- Construction and operation of a brine pipeline to bypass section 2 at St Kilda.
- Progressive rehabilitation and closure planning for the salt fields, including the early preparation of land in section 1 at Dry Creek for future development and housing.
- Improvements to existing monitoring requirements and closure alignment with the expectations of other government agencies, including the EPA and DEW.
DEM will provide further updates on this page as they become available.
St Kilda groundwater monitoring network
A monitoring network of six groundwater testing wells, commissioned by the Department for Energy and Mining (DEM) and City of Salisbury, was installed in 2022 on public land in the St Kilda township to provide a better understanding of the salinity and depth to groundwater in that area over time. Well locations are shown in the map below.
Download a copy of the map: St Kilda township groundwater monitoring network with well locations (PDF, 1.4 MB)
Results
During 2024 groundwater heads have stabilised. Salinity (measured as total dissolved solids or TDS) results indicate saline (GW2 and GW3) to hypersaline (GW01, GW04, GW05 and GW06) groundwater. Since July 2024 GW02 has been blocked and unable to be sampled.


31 July 2024: Dry Creek and St Kilda groundwater monitoring update
Dry Creek monitoring data update
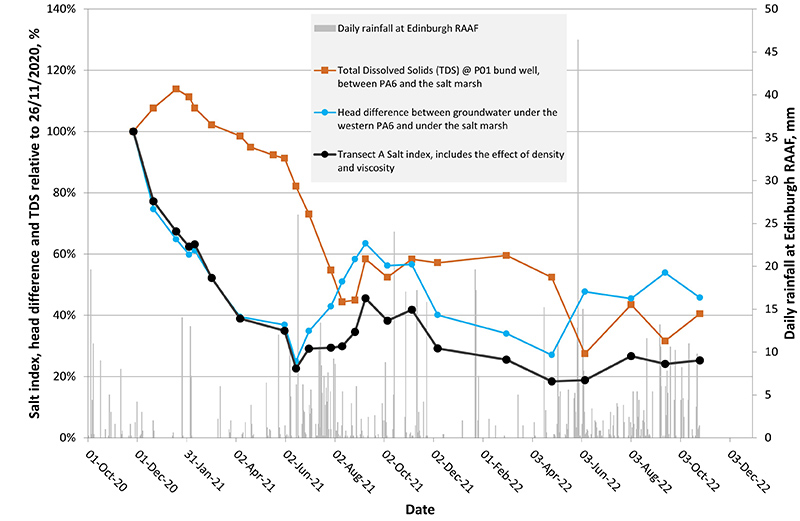
Monitoring results to 14 June 2024 are summarised in the graph below.

The results are derived from a cross-section of salt pond PA6 at St Kilda, running from east to west into the salt marsh - the nearest transect to the impacted mangrove swamp.
Trends in the salt index
General
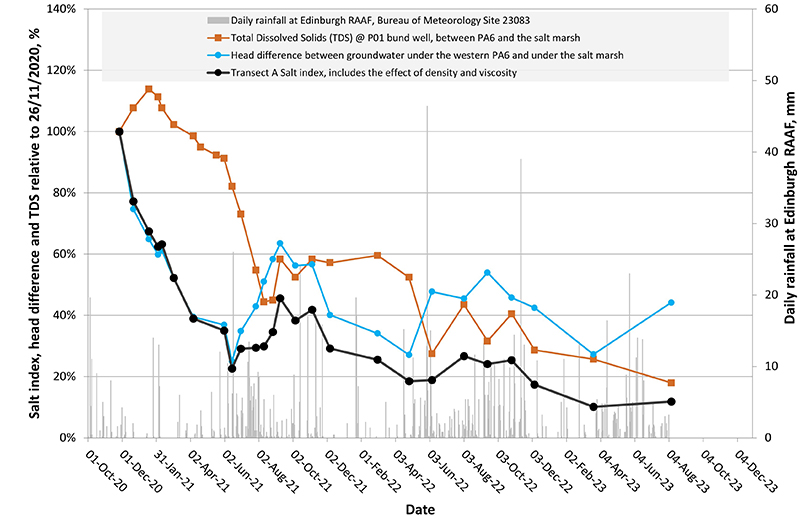
The Transect A salt index indicates a continued general decline in salt moving from the salt pond to the impacted salt marsh with seasonal variation, attributed to winter rainfall, summer evaporation and tidal movements. June 2024 monitoring results indicate a 95% reduction in the salt index since monitoring commenced in 2020.
St Kilda groundwater monitoring network
A monitoring network of six groundwater testing wells, commissioned by the Department for Energy and Mining (DEM) and City of Salisbury, was installed in 2022 on public land in the St Kilda township to provide a better understanding of the salinity and depth to groundwater in that area over time.
Results
Groundwater heads vary between 0.35 m AHD (GW01 in the south) and 1.4m AHD (GW05 and GW06 in the north) and were stable in each well up to late 2023.
During 2024 groundwater heads declined, most likely due to the dry summer of 2023/24. Salinity (measured as total dissolved solids or TDS) results indicate saline (GW2 and GW3) to hypersaline (GW01, GW04, GW05 and GW06) groundwater. Large variations occurred in the salinity of GW01 and GW05.


1 September 2023: Dry Creek and St Kilda groundwater monitoring update
Dry Creek monitoring data update
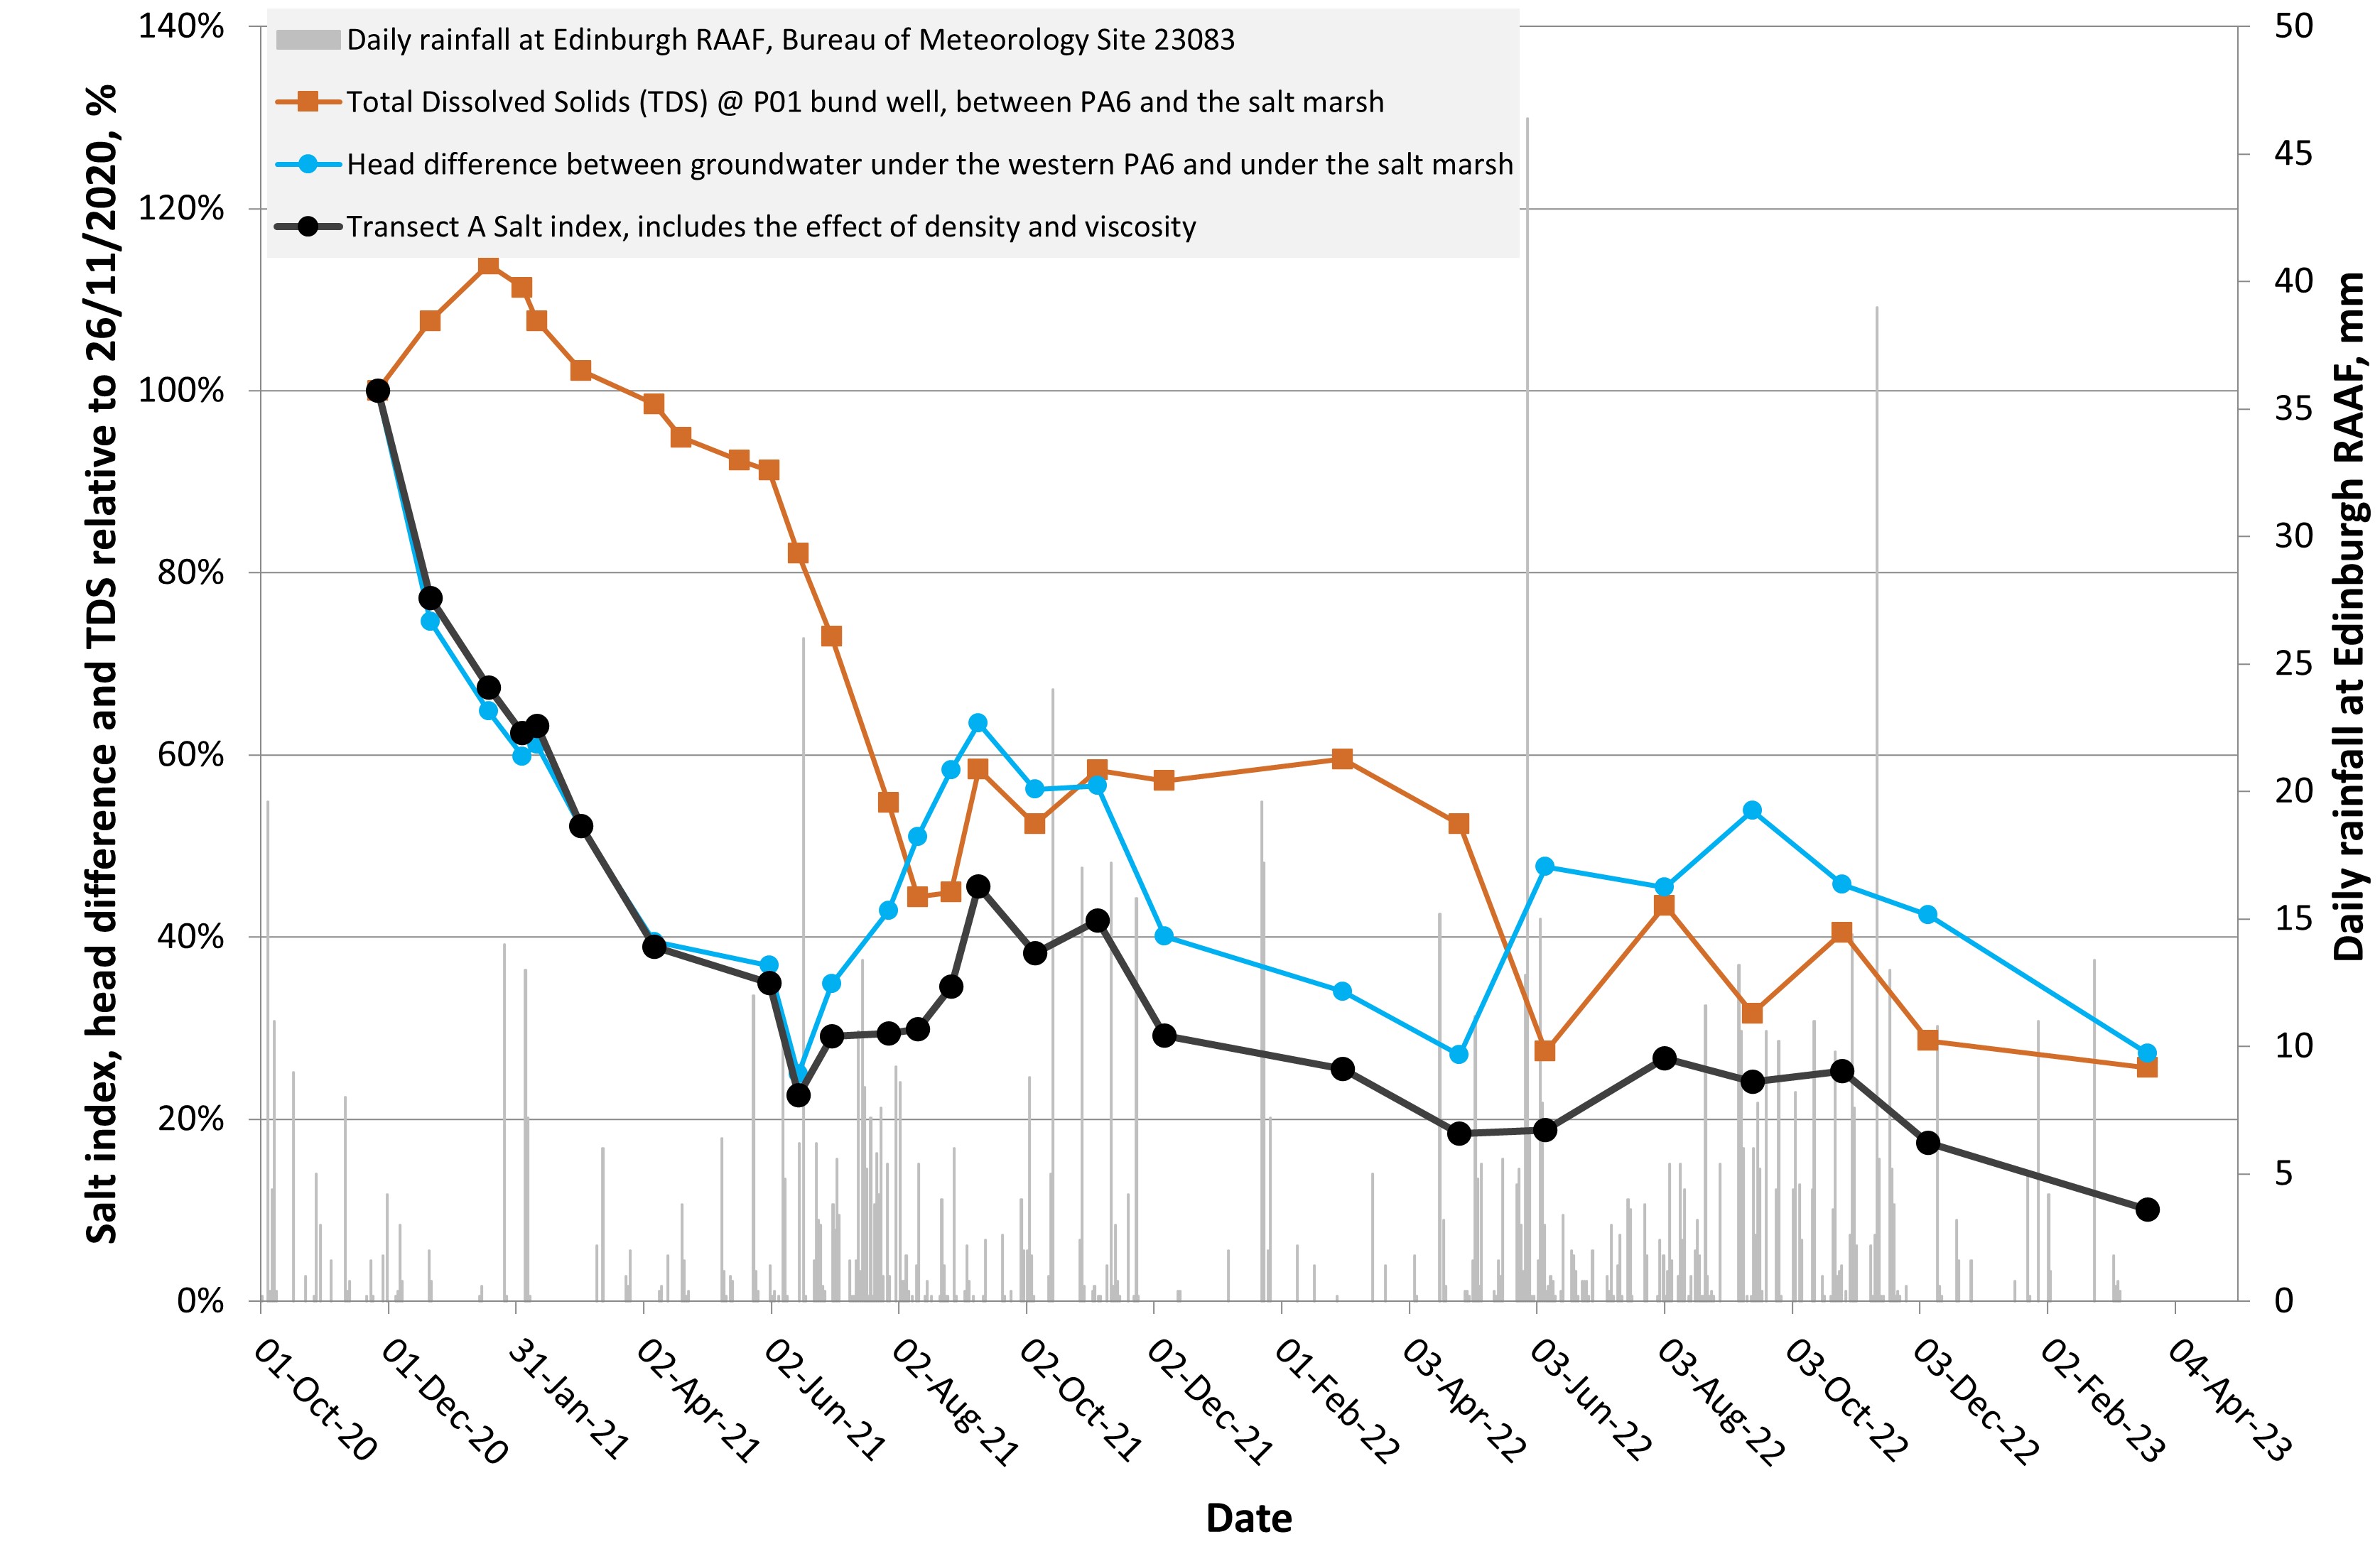
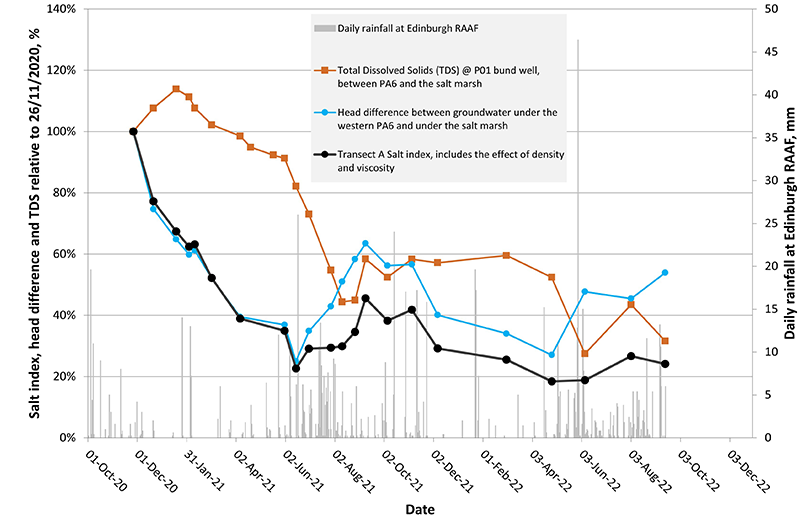
Monitoring results to 8 August 2023 are summarised in the graph below.
The results are derived from a cross-section of salt pond PA6 at St Kilda, running from east to west into the salt marsh - the nearest transect to the impacted mangrove swamp.
Trends in the salt index
General
The Transect A salt index indicates a general decline in salt moving from the salt pond to the impacted salt marsh with seasonal variation, attributed to winter rainfall, summer evaporation and tidal movements.
Winter trends
The annual winter salt index shows a declining trend since 2021.
During the winters of 2022 and 2023, the salt index remained stable due to a combination of increasing groundwater head difference and a reduction in salinity (likely due to tidal influence and winter rain dilution).
A comparison of winter measurements indicate the following decline in salt index:
| Winter | Salt index | % Index reduction |
|---|---|---|
| 2021 | 40% | 60% |
| 2022 | 20% | 80% |
| 2023 | 12% | 88% |
Summer trends
During the summer of 2022/23, the salt index decreased from 25% to 10% due to a decreasing groundwater head difference. This is consistent with the trends observed during the previous two summers and likely due to low rainfall and high evaporation.
A comparison of summer measurements demonstrate the following decline in salt index:
| Summer | Salt index | % Index reduction |
|---|---|---|
| 2021 | 50% | 50% |
| 2022 | 25% | 75% |
| 2023 | 10% | 90% |
Historical
From November 2020 to June 2021, a steep decline in salt index occurred due to significantly decreasing head difference and overall salinity. This was caused by:
- cessation of brine transfers into Pond PA6 following an environmental direction under the Mining Act 1971 issued by DEM to Buckland Dry Creek Pty Ltd
- low rainfall combined with high evaporation during the summer commencing December 2020, and
- the pumping of brine from pond PA6 away from the marsh in March and April 2021, through a clean-up authorisation issued under the Environment Protection Act 1993.
From June to November 2021 the salt index remained stable due to a combination of increasing groundwater head difference and a significant reduction in salinity (likely due to tidal influence and winter rain dilution).
Left Y axis
Ratio of Transect A salt index, groundwater head difference and total dissolved solids (TDS) shown as a percentage, 100% = November 2020.
- TDS - total dissolved solids
- A measure of salinity - which is the salt concentration of water
- Head difference
- Groundwater head – a measure of energy contained in groundwater. Groundwater flows from positions of high head to positions of lower head along a hydraulic gradient
- Groundwater head difference – the difference between the groundwater energy under the pond (higher head) and groundwater under the salt marsh (lower head)
- Transect A salt index
- A measure of trends in the salt moving west from the salt ponds towards the salt marsh: a product of the hydraulic head difference between groundwater under the pond and groundwater under the marsh, and the salinity, adjusted for viscosity (resistance against flow due to the amount of salt)
Right Y axis
Daily rainfall measurements in mm at RAAF Edinburgh weather monitoring station Bureau of Meteorology No. 23083.
X axis
Dates from 1 October 2020 to 3 December 2022
St Kilda groundwater monitoring network
A monitoring network of six groundwater testing wells, commissioned by the Department for Energy and Mining (DEM) and City of Salisbury, was installed on public land in the St Kilda township to provide a better understanding of the salinity and depth to groundwater in that area over time.
Results of the last three rounds of monitoring:
| 12 May 2023 | 4 July 2023 | 15 August 2023 | ||||
|---|---|---|---|---|---|---|
| Well no. | Total dissolved solids (TDS - mg/L) | Depth to water (metres) | Total dissolved solids (TDS) (mg/l) | Depth to water (metres) | Total dissolved solids (TDS) (mg/l) | Depth to water (metres) |
| GW01 | 45,885 | 2.08 | 54,026 | 2.05 | 37,745 | 2.05 |
| GW02 | 2,758* | 1.79 | 2,260* | 1.73 | 6,623* | 1.77 |
| GW03 | 4,933* | 1.335 | 3,615* | 1.25 | 11,360* | 1.28 |
| GW04 | 13,324 | 1.7 | 21,464 | 1.63 | 13,324 | 1.62 |
| GW05 | 78,447 | 1.67 | 119,149 | 1.61 | 135,430 | 1.64 |
| GW06 | 54,026 | 1.6 | 54,026 | 1.53 | 62,166 | 1.6 |
NOTE: TDS was calculated from groundwater density except those denoted by an asterisk (*), calculated from electrical conductivity (EC) measurements using a factor of 0.55. At low salinities or densities, the estimation of TDS is more reliable from EC than from density.
DEM and the City of Salisbury will continue to monitor these sites to understand seasonal variation and other related trends.
Data will be retained in SA Geodata and can be accessed through either Water Connect (https://www.waterconnect.sa.gov.au/Pages/Home.aspx) or the South Australian Resources Information Gateway (SARIG) (https://map.sarig.sa.gov.au).
Well locations are shown in the Dry Creek well locations map below.
Download a copy of the map: St Kilda township groundwater monitoring network with well locations (PDF, 1.4 MB)
Total dissolved solids (TDS) is a measure of salt concentration in water. Salinity by total salt concentration can be classified into the following groups:
| TDS (mg/L) | Description and use |
|---|---|
| <500 | Fresh: drinking and all irrigation |
| 500–1,000 | Marginal: Most irrigation, adverse effects on ecosystems becoming apparent |
| 1,000–2,000 | Brackish: Irrigation certain crops only; useful for most stock |
| 2,000–10,000 | Saline: Useful for most livestock |
| 10,000–35,000 | Highly saline: Very saline groundwater, limited use for certain livestock |
| >35,000 | Brine (or hypersaline): Some mining and industrial uses exist |
Classifications from Mayer, XM, Ruprecht, JK and Bari, MA 2005, Stream salinity status and trends in south-west Western Australia, Department of Environment, Salinity and land use impacts series, Report No. SLUI 38.
Dry Creek monitoring data update
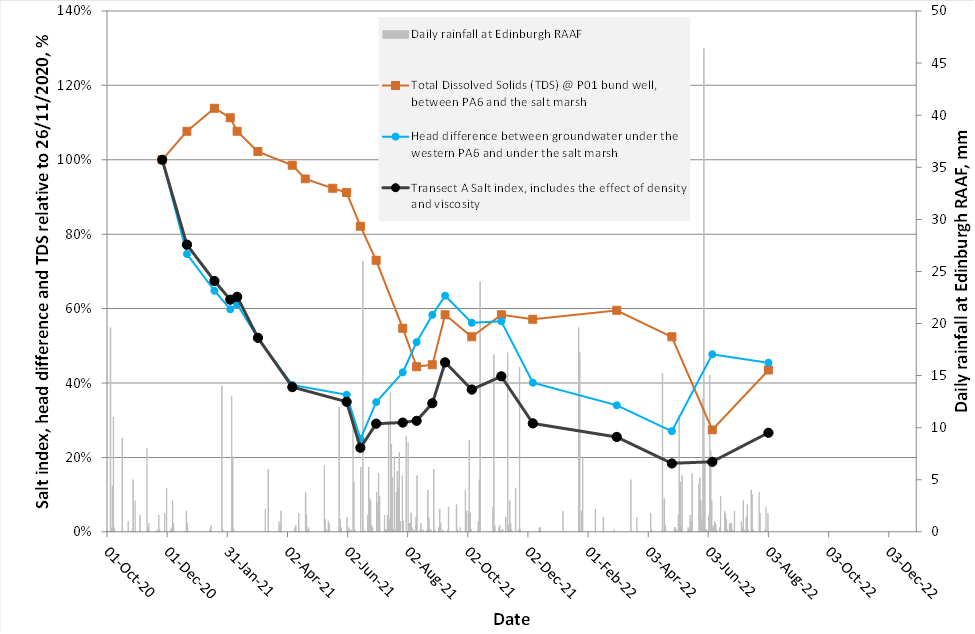
Monitoring results to 22 March 2023 are summarised in the graph below.
The results are derived from a cross-section of salt pond PA6 at St Kilda, running from east to west into the salt marsh - the nearest transect to the impacted mangrove swamp.
Trends in the salt index
General
The Transect A salt index indicates a general decline in salt moving from the salt pond to the impacted salt marsh with seasonal variation, attributed to winter rainfall, summer evaporation and tidal movements.
Summer trends
During the summer of 2022/3, the salt index decreased from 25% to 10% due to a decreasing groundwater head difference. This is consistent with the trends observed during the previous two summers and likely due to low rainfall and high evaporation.
Comparison of end summer half-year measurements clearly show the general decline:
| Summer | Salt index | % Index reduction |
|---|---|---|
| 2021 | 50% | 50% |
| 2022 | 25% | 75% |
| 2023 | 10% | 90% |
Winter trends
During the winter of 2022, the salt index remained stable due to a combination of increasing groundwater head difference and a reduction in salinity as a result of tidal influence and winter rain dilution.
Comparison of end winter measurements indicate the salt index reduction:
| Winter | Salt index | % Index reduction |
|---|---|---|
| 2021 | 40% | 60% |
| 2022 | 20% | 80% |
Historical
From June to November 2021 the salt index remained stable due to a combination of increasing groundwater head difference and a significant reduction in salinity as a result of tidal influence and winter rain dilution.
From November 2020 to June 2021, a steep decline occurred due to significantly decreasing head difference and overall stable salinity, because of:
- cessation of brine transfers into Pond PA6 following an environmental direction under the Mining Act 1971 issued by DEM to Buckland Dry Creek Pty Ltd
- low rainfall combined with high evaporation during the summer commencing December 2020
- the EPA pumping brine from pond PA6 away from the marsh in March and April 2021 through a clean-up authorisation issued under the Environment Protection Act 1993.
Left Y axis
Ratio of Transect A salt index, groundwater head difference and total dissolved solids (TDS) shown as a percentage, 100% = November 2020.
- TDS - total dissolved solids
- A measure of salinity - which is the salt concentration of water
- Head difference
- Groundwater head – a measure of energy contained in groundwater. Groundwater flows from positions of high head to positions of lower head along a hydraulic gradient
- Groundwater head difference – the difference between the groundwater energy under the pond (higher head) and groundwater under the salt marsh (lower head)
- Transect A salt index
- A measure of trends in the salt moving west from the salt ponds towards the salt marsh: a product of the hydraulic head difference between groundwater under the pond and groundwater under the marsh, and the salinity, adjusted for viscosity (resistance against flow due to the amount of salt)
Right Y axis
Daily rainfall measurements in mm at RAAF Edinburgh weather monitoring station Bureau of Meteorology No. 23083.
X axis
Dates from 1 October 2020 to 3 December 2022
St Kilda groundwater monitoring network
A monitoring network of six groundwater testing wells, commissioned by the Department for Energy and Mining (DEM) and City of Salisbury, was installed on public land in the St Kilda township to provide a better understanding of the salinity and depth to groundwater in that area over time.
Results of the last three rounds of monitoring:
| 7 December 2022 | 3 February 2023 | 21 March 2023 | ||||
|---|---|---|---|---|---|---|
| Well no. | Total dissolved solids (TDS - mg/L) | Depth to water (metres) | Total dissolved solids (TDS - mg/L) | Depth to water (metres) | Total dissolved solids (TDS - mg/L) | Depth to water (metres) |
| GW01 | 135,430 | 2.07 | 78,447 | 2.06 | 127,290 | 2.12 |
| GW02 | 2,220* | 1.805 | 2,140* | 1.81 | 4,170* | 1.83 |
| GW03 | 2,631* | 1.23 | 4,290* | 1.3 | 5,740* | 1.36 |
| GW04 | 13,324 | 1.545 | 5,183 | 1.6 | 13,324 | 1.66 |
| GW05 | 45,885 | 1.58 | 70,307 | 1.64 | 62,166 | 1.69 |
| GW06 | 54,026 | 1.56 | 62,166 | 1.63 | 70,307 | 1.55 |
NOTE: TDS was calculated from groundwater density except those denoted by an asterisk (*), calculated from electrical conductivity (EC) measurements using a factor of 0.55. At low salinities or densities, the estimation of TDS is more reliable from EC than from density.
DEM and the City of Salisbury will continue to monitor these sites to understand seasonal variation and other related trends.
Data will be retained in SA Geodata and can be accessed through either Water Connect (https://www.waterconnect.sa.gov.au/Pages/Home.aspx) or SARIG (https://map.sarig.sa.gov.au).
Well locations are shown in the Dry Creek well locations map below.
Download a copy of the map: St Kilda township groundwater monitoring network with well locations (PDF, 1.4 MB)
Total dissolved solids (TDS) is a measure of salt concentration in water. Salinity by total salt concentration can be classified into the following groups:
| TDS (mg/L) | Description and use |
|---|---|
| <500 | Fresh: drinking and all irrigation |
| 500–1,000 | Marginal: Most irrigation, adverse effects on ecosystems becoming apparent |
| 1,000–2,000 | Brackish: Irrigation certain crops only; useful for most stock |
| 2,000–10,000 | Saline: Useful for most livestock |
| 10,000–35,000 | Highly saline: Very saline groundwater, limited use for certain livestock |
| >35,000 | Brine (or hypersaline): Some mining and industrial uses exist |
Classifications from Mayer, XM, Ruprecht, JK and Bari, MA 2005, Stream salinity status and trends in south-west Western Australia, Department of Environment, Salinity and land use impacts series, Report No. SLUI 38.
Dry Creek monitoring data update
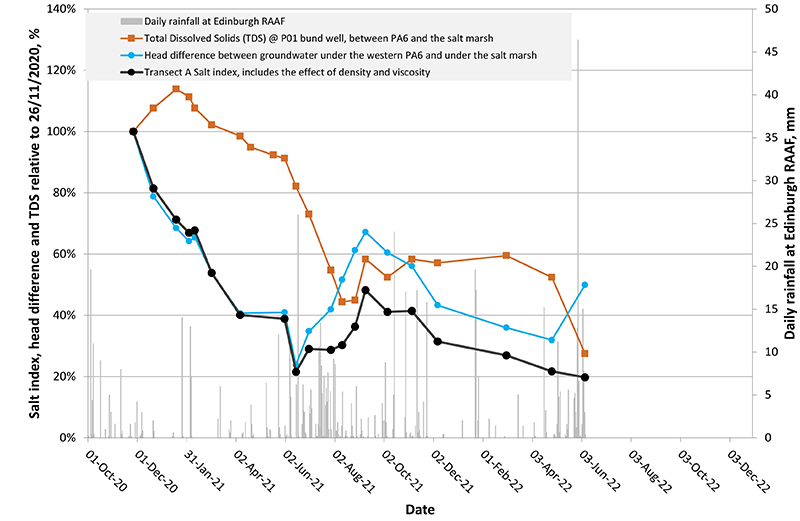
Monitoring results to 7 December 2022 are summarised in the graph below.
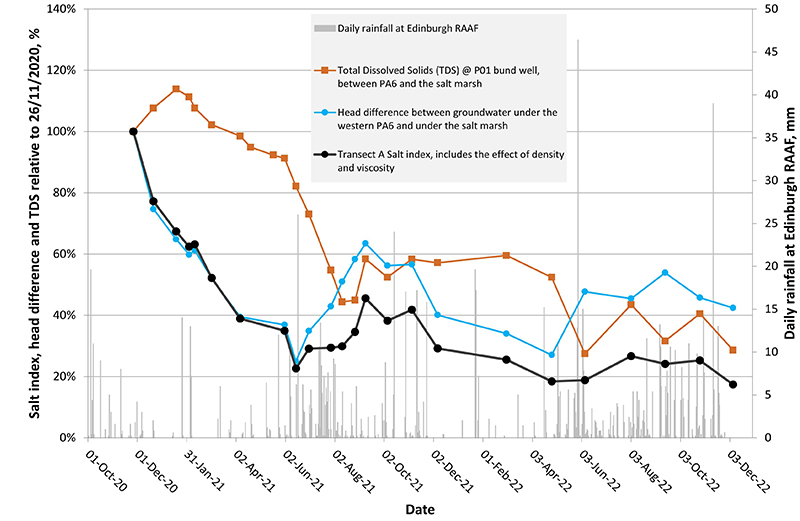
The results are derived from a cross-section of salt pond PA6 at St Kilda, running from east to west into the salt marsh - the nearest transect to the impacted mangrove swamp.
Trends in the salt index
- The Transect A salt index indicates a general decline in salt moving from the salt pond to the impacted salt marsh with some evident seasonal variation attributed to winter rainfall and tidal movements.
- An end of winter half-year comparison indicates that the salt index has reduced from about 40% in 2021 to less than 20% in 2022.
- During the winter of 2022, the salt index remained stable due to a combination of increasing groundwater head difference and a reduction in salinity as a result of tidal influence and winter rain dilution.
- During the summer of 2021/22, the salt index decreased, similar to the summer of 2020/21, due to low rainfall combined with high evaporation.
- From June to November 2021 the salt index remained stable due to a combination of increasing groundwater head difference and a significant reduction in salinity as a result of tidal influence and winter rain dilution.
- From November 2020 to June 2021, a steep decline occurred due to significantly decreasing head difference and overall stable salinity, because of:
- brine transfers into Pond PA6 ceasing following an environmental direction issued by DEM to Buckland Dry Creek Pty Ltd
- low rainfall combined with high evaporation during summer 2021
- the EPA pumping brine from pond PA6 away from the marsh in March and April 2021.
Left Y axis
Ratio of Transect A salt index, groundwater head difference and total dissolved solids (TDS) shown as a percentage, 100% = November 2020.
- TDS - total dissolved solids
- A measure of salinity - which is the salt concentration of water
- Head difference
- Groundwater head – a measure of energy contained in groundwater. Groundwater flows from positions of high head to positions of lower head along a hydraulic gradient
- Groundwater head difference – the difference between the groundwater energy under the pond (higher head) and groundwater under the salt marsh (lower head)
- Transect A salt index
- A measure of trends in the salt moving west from the salt ponds towards the salt marsh: a product of the hydraulic head difference between groundwater under the pond and groundwater under the marsh, and the salinity, adjusted for viscosity (resistance against flow due to the amount of salt)
Right Y axis
Daily rainfall measurements in mm at RAAF Edinburgh weather monitoring station Bureau of Meteorology No. 23083.
X axis
Dates from 1 October 2020 to 3 December 2022
The South Australian government continues to monitor salt migration to the salt marsh and assess environmental conditions.
St Kilda groundwater monitoring network
Six groundwater testing wells have been installed on public land in the St Kilda township to provide the South Australian Government and the City of Salisbury a better understanding of the salinity and depth to groundwater in that area over time.
The results of the last two monitoring rounds, performed on 27 October 2022 and 7 December 2022, were:
| 27 October 2022 | 7 December 2022 | |||
|---|---|---|---|---|
| Well no. | Total dissolved solids (TDS - mg/L) | Depth to water (metres) | Total dissolved solids (TDS - mg/L) | Depth to water (metres) |
| GW01 | 111,009 | 2.02 | 135,430 | 2.07 |
| GW02 | 2,840* | 1.8 | 2,220* | 1.805 |
| GW03 | 3,780 | 1.22 | 2,631* | 1.23 |
| GW04 | 37,745 | 1.55 | 13,324 | 1.545 |
| GW05 | 62,166 | 1.59 | 45,885 | 1.58 |
| GW06 | 70,307 | 1.58 | 54,026 | 1.56 |
NOTE: TDS was calculated from groundwater density except those denoted by an asterisk (*), calculated from electrical conductivity (EC) measurements using a factor of 0.55. At low salinities or densities, the estimation of TDS is more reliable from EC than from density.
Well locations are shown in the Dry Creek well locations map below.
These data will be retained in SA Geodata and can be accessed through either Water Connect, or through the South Australian Resources Information Geoserver (SARIG)
Download a copy of the map: St Kilda township groundwater monitoring network with well locations (PDF, 1.4 MB)
Total dissolved solids (TDS) is a measure of salt concentration in water. Salinity by total salt concentration can be classified into the following groups:
| TDS (mg/L) | Description and use |
|---|---|
| <500 | Fresh: drinking and all irrigation |
| 500–1,000 | Marginal: Most irrigation, adverse effects on ecosystems becoming apparent |
| 1,000–2,000 | Brackish: Irrigation certain crops only; useful for most stock |
| 2,000–10,000 | Saline: Useful for most livestock |
| 10,000–35,000 | Highly saline: Very saline groundwater, limited use for certain livestock |
| >35,000 | Brine (or hypersaline): Some mining and industrial uses exist |
Classifications from Mayer, XM, Ruprecht, JK and Bari, MA 2005, Stream salinity status and trends in south-west Western Australia, Department of Environment, Salinity and land use impacts series, Report No. SLUI 38.
Dry Creek monitoring data update
Monitoring results to 27 October 2022 are summarised in the graph below.
The results are derived from a cross-section of salt pond PA6 at St Kilda, running from east to west into the salt marsh - the nearest transect to the impacted mangrove swamp.
Trends in the salt index
- The Transect A salt index indicates a general decline in salt moving from the salt pond to the impacted salt marsh with some evident seasonal variation attributed to winter rainfall and tidal movements.
- An end of winter half-year comparison indicates that the salt index has reduced from about 40% in 2021 to about 25% in 2022.
- During the winter of 2022, the salt index remained stable due to a combination of increasing groundwater head difference and a reduction in salinity as a result of tidal influence and winter rain dilution.
- During the summer of 2021/22, the salt index decreased, similar to the summer of 2020/21, due to low rainfall combined with high evaporation.
- From June to November 2021 the salt index remained stable due to a combination of increasing groundwater head difference and a significant reduction in salinity as a result of tidal influence and winter rain dilution.
- From November 2020 to June 2021, a steep decline occurred due to significantly decreasing head difference and overall stable salinity, because of:
- brine transfers into Pond PA6 ceasing following an environmental direction issued by DEM to Buckland Dry Creek Pty Ltd
- low rainfall combined with high evaporation during summer 2021
- the EPA pumping brine from pond PA6 away from the marsh in March and April 2021.
Left Y axis
Ratio of Transect A salt index, groundwater head difference and total dissolved solids (TDS) shown as a percentage, 100% = November 2020.
- TDS - total dissolved solids
- A measure of salinity - which is the salt concentration of water
- Head difference
- Groundwater head – a measure of energy contained in groundwater. Groundwater flows from positions of high head to positions of lower head along a hydraulic gradient
- Groundwater head difference – the difference between the groundwater energy under the pond (higher head) and groundwater under the salt marsh (lower head)
- Transect A salt index
- A measure of trends in the salt moving west from the salt ponds towards the salt marsh: a product of the hydraulic head difference between groundwater under the pond and groundwater under the marsh, and the salinity, adjusted for viscosity (resistance against flow due to the amount of salt)
Right Y axis
Daily rainfall measurements in mm at RAAF Edinburgh weather monitoring station Bureau of Meteorology No. 23083.
X axis
Dates from 1 October 2020 to 3 December 2022
St Kilda groundwater monitoring network
The network of six groundwater testing wells commissioned by DEM and the City of Salisbury has been installed on public land in the St Kilda township. This monitoring network will allow the South Australian government and the City of Salisbury to gain a better understanding of the salinity and depth to groundwater in that area over time.
These data will be retained in SA Geodata and can be accessed through either Water Connect, the South Australian Government’s online portal for information about South Australia’s water resources, or through the South Australian Resources Information Geoserver (SARIG)
Well locations are shown in the Dry Creek well locations map below.
Download a copy of the map: St Kilda township groundwater monitoring network with well locations (PDF, 1.4 MB)
The results of the first two monitoring rounds, performed on 14 September 2022 and 27 October 2022, were as follows:
| 14 September 2022 | 27 October 2022 | |||
|---|---|---|---|---|
| Well no. | Total dissolved solids (TDS - mg/L) | Depth to water (metres) | Total dissolved solids (TDS - mg/L) | Depth to water (metres) |
| GW01 | 119,149 | 2.07 | 111,009 | 2.02 |
| GW02 | 5,183 | 1.81 | 1,562* | 1.8 |
| GW03 | 5,183 | 1.21 | 2,079* | 1.22 |
| GW04 | 29,605 | 1.56 | 37,745 | 1.55 |
| GW05 | 45,885 | 1.60 | 62,166 | 1.59 |
| GW06 | 62,166 | 1.54 | 70,307 | 1.58 |
NOTE: TDS was calculated from groundwater density except those denoted by an asterisk (*), calculated from electrical conductivity (EC) measurements using a factor of 0.55. At low salinities or densities, the estimation of TDS is more reliable from EC than from density. The TDS values for GW2 and GW3 on 27 October 2022 are more reliable than those calculated previously from density on 14 September 2022.
Total dissolved solids (TDS) is a measure of salt concentration in water. Salinity by total salt concentration can be classified into the following groups:
| TDS (mg/L) | Description and use |
|---|---|
| <500 | Fresh: drinking and all irrigation |
| 500–1,000 | Marginal: Most irrigation, adverse effects on ecosystems becoming apparent |
| 1,000–2,000 | Brackish: Irrigation certain crops only; useful for most stock |
| 2,000–10,000 | Saline: Useful for most livestock |
| 10,000–35,000 | Highly saline: Very saline groundwater, limited use for certain livestock |
| >35,000 | Brine (or hypersaline): Some mining and industrial uses exist |
Classifications from Mayer, XM, Ruprecht, JK and Bari, MA 2005, Stream salinity status and trends in south-west Western Australia, Department of Environment, Salinity and land use impacts series, Report No. SLUI 38.
EPA clean-up authorisation
The most recent program of work to remove surface water from a pond at the Dry Creek salt field has ended.
Pumping began in late September and has now ceased after an assessment by State Government agencies (refer https://www.epa.sa.gov.au/files/15387_media_27sep2022.pdf for more information
Dry Creek monitoring data update
Monitoring results to 14 September 2022 are summarised in the graph below.
The results are derived from a cross-section of salt pond PA6 at St Kilda, running from east to west into the salt marsh - the nearest transect to the impacted mangrove swamp.
Recent trends
The graph indicates the following trends:
- A general decline in salt moving from the salt pond to the impacted salt marsh with some evident seasonal variation attributed to winter rainfall and tidal movements.
- During the winter of 2022, the salt index varied between 20 and 25%. In June 2022, the groundwater head difference increased and the salinity decreased, mainly due to high winter rainfall. In August 2022, the reverse occurred: the salt index increased due to an increase in salinity and a small decrease in head difference, likely due to the substantially lower than average rainfall for July. September again saw the groundwater head difference increase and the salinity decrease, mainly due to high winter rainfall.
Historical trends
- From November 2020 to June 2021, a steep decline occurred due to significantly decreasing head difference and overall stable salinity, because of:
- brine transfers into Pond PA6 ceasing following an environmental direction issued by DEM to Buckland Dry Creek Pty Ltd
- low rainfall combined with high evaporation during summer 2021
- the EPA pumping brine from pond PA6 away from the marsh in March and April 2021.
- From June to November 2021 the salt index remained stable due to a combination of increasing groundwater head difference (see description above) and a significant reduction in salinity as a result of tidal influence and winter rain dilution.
- During the summer of 2021/22, the salt index decreased, similar to the summer of 2020/21, due to low rainfall combined with high evaporation.
- During the winter of 2022, the salt index remained stable due to a combination of increasing groundwater head difference (see description above) and a reduction in salinity as a result of tidal influence and winter rain dilution.
- An end of winter half-year comparison indicates that the salt index has reduced from about 40% in 2021 to about 25% in 2022.
Understanding the graph
Left Y axis
Ratio of Transect A salt index, groundwater head difference and total dissolved solids (TDS) shown as a percentage
- TDS - total dissolved solids
- A measure of salinity - which is the salt concentration of water
- Head difference
- Groundwater head – a measure of energy contained in groundwater. Groundwater flows from positions of high head to positions of lower head along a hydraulic gradient
- Groundwater head difference – the difference between the groundwater energy under the pond (higher head) and groundwater under the salt marsh (lower head)
- Transect A salt index
- A measure of trends in the salt moving west from the salt ponds towards the salt marsh: a product of the hydraulic head difference between groundwater under the pond and groundwater under the marsh, and the salinity, adjusted for viscosity (resistance against flow due to the amount of salt)
Right Y axis
Daily rainfall measurements in mm at RAAF Edinburgh weather monitoring station
X axis
Dates from 1 October 2020 to 3 December 2022
The South Australian government continues to monitor salt migration to the salt marsh and assess environmental conditions.
EPA clean-up authorisation
The EPA has also been conducting a separate targeted monitoring program of affected areas of saltmarsh. Recent results showed that hypersaline water was present at one location in the saltmarsh. This resulted in a new clean-up order being issued to the owner of the saltfield.
More information about the clean-up authorisation is available from the EPA media release on the EPA website.
St Kilda groundwater monitoring network
The network of six groundwater testing wells commissioned by the DEM and City of Salisbury has been installed on public land in the St Kilda township. This monitoring network will allow the South Australian government and the City of Salisbury to gain a better understanding of the salinity and depth to groundwater in that area over time. This data will be retained in Water Connect, the South Australian Government’s online portal for information about South Australia’s water resources.
Well locations are shown in the Dry Creek well locations map below.
Download a copy of the map: St Kilda township groundwater monitoring network with well locations (PDF, 1.4 MB)
The results of the first monitoring round, performed on 14 September 2022, were as follows:
| Well number | Total dissolved solids (TDS - mg/L)* | Depth to water (metres) |
|---|---|---|
| GW01 | 119,149 | 2.07 |
| GW02 | 5,183 | 1.81 |
| GW03 | 5,183 | 1.21 |
| GW04 | 29,605 | 1.56 |
| GW05 | 45,885 | 1.60 |
| GW06 | 62,166 | 1.54 |
| *TDS was calculated from groundwater density | ||
Understanding the table
Total dissolved solids (TDS) is a measure of salt concentration in water. Salinity by total salt concentration can be classified into the following groups:
| TDS (mg/L) | Description and use |
|---|---|
| <500 | Fresh: drinking and all irrigation |
| 500–1,000 | Marginal: Most irrigation, adverse effects on ecosystems becoming apparent |
| 1,000–2,000 | Brackish: Irrigation certain crops only; useful for most stock |
| 2,000–10,000 | Saline: Useful for most livestock |
| 10,000–35,000 | Highly saline: Very saline groundwater, limited use for certain livestock |
| >35,000 | Brine (or hypersaline): Some mining and industrial uses exist |
Classifications from Mayer, XM, Ruprecht, JK and Bari, MA 2005, Stream salinity status and trends in south-west Western Australia, Department of Environment, Salinity and land use impacts series, Report No. SLUI 38.
St Kilda groundwater monitoring network
The Department for Energy and Mining (DEM) and City of Salisbury have commissioned a network of groundwater testing wells to be installed on public land in the St Kilda township.
This monitoring network will allow the South Australian government and the City of Salisbury to gain a better understanding of the salinity and depth to groundwater in that area over time.
Weather-permitting, installation is anticipated to start in the week of 15 August and should be completed within a week. Monitoring will start immediately after that.
Dry Creek monitoring data update
Monitoring results to 3 August 2022 are summarised in the graph below.
The results are derived from a cross-section of salt pond PA6 at St Kilda, running from east to west into the salt marsh - the nearest transect to the impacted mangrove swamp.
Recent trends
The graph indicates the following trends:
- A general decline in salt moving from the salt pond to the impacted salt marsh with some evident seasonal variation attributed to winter rainfall and tidal movements.
- In June 2022, the groundwater head difference increased and the salinity decreased, mainly due to the high rainfall just a few days before the measurements. By August 2022, the salt index increased due to an increase in salinity. It is likely that this is due to substantially lower than average
rainfall for July. However it is noted there has been an overall downward trend in the salt index since monitoring began. DEM will continue to observe this trend.
Historical trends
- From November 2021 to April 2022, the salt index decreased due to decreasing head difference and stable salinity.
- From June to November 2021, the salt index remained stable due to a combination of increasing groundwater head difference (see description above) and a significant reduction in salinity as a result of tidal influence and winter rain dilution.
- From November 2020 to June 2021, a steep decline occurred due to:
- brine transfers into Pond PA6 ceasing following an environmental direction issued by DEM to Buckland Dry Creek Pty Ltd
- low rainfall combined with high evaporation during summer 2021
- the EPA pumping brine from pond PA6 away from the marsh in March and April 2021.
Understanding the graph
Left Y axis
Ratio of Transect A salt index, groundwater head difference and total dissolved solids (TDS) shown as a percentage
- TDS - total dissolved solids
- A measure of salinity - which is the salt concentration of water
- Head difference
- Groundwater head – a measure of energy contained in groundwater. Groundwater flows from positions of high head to positions of lower head along a hydraulic gradient
- Groundwater head difference – the difference between the groundwater energy under the pond (higher head) and groundwater under the salt marsh (lower head)
- Transect A salt index
- A measure of trends in the salt moving west from the salt ponds towards the salt marsh: a product of the hydraulic head difference between groundwater under the pond and groundwater under the marsh, and the salinity, adjusted for viscosity (resistance against flow due to the amount of salt)
Right Y axis
Daily rainfall measurements in mm at RAAF Edinburgh weather monitoring station
X axis
Dates from 1 October 2020 to 3 December 2022
The South Australian government continues to monitor salt migration to the salt marsh and assess environmental conditions.
May 2022 monitoring results are summarised in the graph below.
The results are derived from a cross-section of salt pond PA6 at St Kilda, running from east to west into the salt marsh - the nearest transect to the impacted mangrove swamp.
Understanding the graph
Left Y axis
Ratio of Transect A salt index, groundwater head difference and total dissolved solids (TDS) shown as a percentage
- TDS - total dissolved solids
- A measure of salinity - which is the salt concentration of water
- Head difference
- Groundwater head – a measure of energy contained in groundwater. Groundwater flows from positions of high head to positions of lower head along a hydraulic gradient
- Groundwater head difference – the difference between the groundwater energy under the pond (higher head) and groundwater under the salt marsh (lower head)
- Transect A salt index
- A measure of trends in the salt moving west from the salt ponds towards the salt marsh: a product of the hydraulic head difference between groundwater under the pond and groundwater under the marsh, and the salinity, adjusted for viscosity (resistance against flow due to the amount of salt)
Right Y axis
Daily rainfall measurements in mm at RAAF Edinburgh
X axis
Dates from 1 October 2020 to 3 December 2022
Trends
The graph indicates the following trends.
- A decline in salt moving from the salt pond to the impacted salt marsh with some evident seasonal variation attributed to winter rainfall and tidal movements.
- From November 2020 to June 2021, a steep decline occurred due to:
- brine transfers into Pond PA6 ceasing following an environmental direction issued by DEM to Buckland Dry Creek Pty Ltd
- low rainfall combined with high evaporation during summer 2021
- the EPA pumping brine from pond PA6 away from the marsh in March and April 2021.
- From June to November 2021, the salt index remained stable due to a combination of increasing groundwater head difference (see description above) and a significant reduction in salinity as a result of tidal influence and winter rain dilution.
- From November 2021 to April 2022, the salt index decreased due to decreasing head difference and stable salinity.
- In June 2022, the groundwater head difference increased and the salinity decreased, mainly due to the high rainfall just a few days prior to the measurements.
Note: DEM has updated the calculation methodology for the salt index to better account for variations in saturated aquifer thickness, which is the distance from the water table to the base of the aquifer. When groundwater heads increase, so does the average saturated aquifer thickness through which groundwater flow occurs.
The update in calculation methodology has not had any significant impact on the observed trends, showing an average of -2% difference from the previous salt index.
The South Australian government is aware that salt continues to migrate to the salt marsh and will continue to monitor and take action as required.
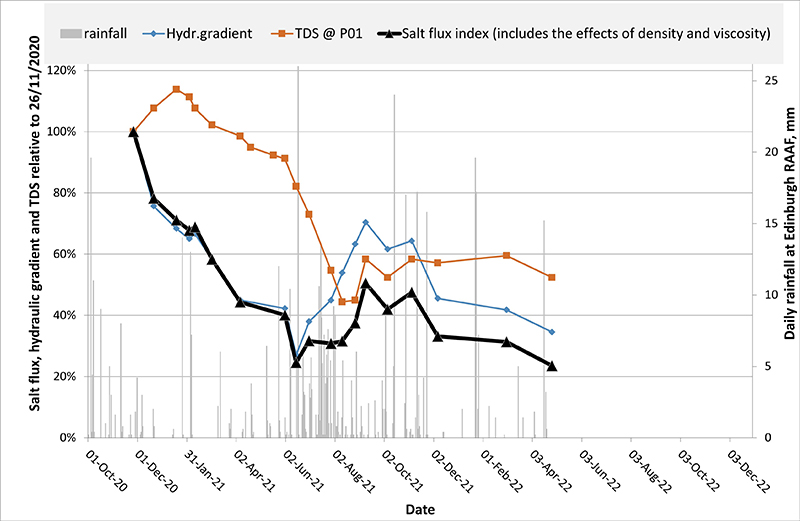
The April 2022 monitoring results, from a section through pond PA6 (in Section 2, adjacent St Kilda) towards the St Kilda mangrove boardwalk area, are summarised in the graph below.
The results show further decline of the hydraulic gradient, total dissolved solids and salt flux index.
Compared to November 2020 levels, the hydraulic gradient has now declined by approximately 70%, salinity (measured as Total Dissolved Solids or TDS) has declined by approximately 45%, and salt flux has declined by 75%.
Notwithstanding these results the South Australian government is aware that salt continues to migrate to the marine environment, and will continue to monitor and take action as required.
The next round of monitoring is scheduled for early June and a further update will be provided at that time. The Department for Energy and Mining will continue monitoring in 2022.
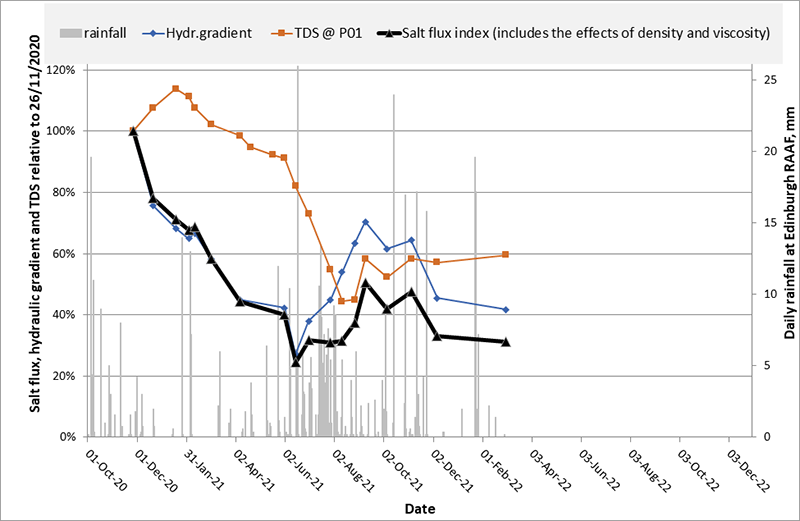
The results of the March 2022 groundwater sampling from a section through pond PA6 (in Section 2, adjacent St Kilda) towards the mangrove boardwalk area are summarised in the graph below.
These results indicate no significant change in key indicators since the previous update in December 2021.
Water quality monitoring commenced at the site in November 2020 following observations of impacted vegetation. Compared to November 2020 levels, the hydraulic gradient has declined by approximately 60%, salinity (measured as Total Dissolved Solids or TDS) has declined by approximately 40%, and salt flux has declined by approximately 70%.
The decline in key indicators since November 2020 is encouraging. However salt does continue to migrate from Section 2 of the salt field to the marine environment, and the South Australian government continues to monitor environmental conditions and take necessary actions based on the monitoring results. The Department for Energy and Mining will continue monitoring until the end of 2022.
Environment Protection Authority investigation
The Environment Protection Authority (EPA) investigation into whether any offences were committed in relation to the dieback of mangroves at St Kilda is expected to be completed by mid-2022.
Reports from EPA scientists and specialist experts are being compiled now, ahead of completing the investigation report. A brief of evidence will be submitted to the Crown Solicitor for review and the outcome of the investigation will ultimately be made public.
Complex EPA investigations can take 12 months or longer, particularly where scientific evidence is required. This EPA investigation has included identifying and commissioning work from independent experts, whose expertise would be recognised by a court of law. It has also required two seasons of monitoring to collect sufficient data for consideration by the experts, and the management of site visits in line with COVID restrictions.
The EPA is an independent regulator and its investigations are independent of government decisions.
Results of groundwater sampling, pumping into Bolivar outfall, BDC annual compliance report, extent of dieback update, tree health in St Kilda
The South Australian government continues to monitor activities and environmental conditions in, and adjacent to, the St Kilda area of the Dry Creek Salt Field and take necessary actions based on the results of this monitoring.
The results of the December 2021 groundwater sampling from a section through pond PA6 (in Section 2, adjacent St Kilda) towards the mangrove boardwalk area are summarised in the graph below.
These results indicate that while salt continues to migrate towards the marsh, the salt flux, hydraulic gradient, and total dissolved solids (TDS) at this monitoring location adjacent to Section 2 of the salt field (the section closest to the affected St Kilda mangroves) have all declined since the previous month. These declines follow minor increases in November, corresponding with recent rainfall patterns.

Bolivar outfall
Brine from the northern ponds continues to be pumped into the nearby SA Water Bolivar outfall channel north of St Kilda, to dilute the concentration of salt with treated wastewater and safely release it back to the marine environment. This action is being taken as part of the management of the salt field by site operator Buckland Dry Creek (BDC), and aims to establish environmental stability for the pond ecosystems for the short-term.
Approximately 3.5 gigalitres of brine from the northern ponds (Section 3) has now been discharged through the Bolivar outfall channel since BDC commenced pumping on 29 May 2021. This has returned and maintained the salinity in Section 3 to historic operating levels.
The South Australian government also continues to monitor BDC’s management and maintenance of pond infrastructure including the previously observed erosion in parts of the sea wall. A works program to address the previously identified sea wall erosion has now been completed by BDC.
Annual Compliance Report
On 1 December 2021, BDC submitted their annual compliance report. BDC are required to provide this report on their compliance with the Mining Act 1971. The report is currently under review for compliance with Regulation 77 of the Mining Regulations 2020, and may be subject to change. The report will be made available on this website once it is accepted by the Department for Energy and Mining (DEM) as complying with Regulation 77 and reporting requirements.
Extent of St Kilda mangrove dieback
The Department for Environment and Water (DEW) has recently conducted a recapture of dieback data both from the air and on ground in October 2021. The data collected is now being analysed to confirm any changes to the extent of dieback, and provide valuable additional information on the health of the mangrove and saltmarsh ecosystems.
The results of this recent recapture will be compared with DEW’s hyperspectral aerial imagery data captured in March 2021. This March data classified dieback mapping into mangrove, saltmarsh, bare ground, and water. The data determined the dieback boundary contains approximately 9 hectares of mangrove, 10 hectares of saltmarsh, and nearly 5 hectares of bare, sparsely vegetated, or aquatic ecosystems. The dead mangrove area represents 0.45% of the local Barker Inlet mangrove community, and the dead saltmarsh area represents 1.4% of the local intertidal saltmarsh community.
Planted tree health in St Kilda
DEM has received a report of a preliminary assessment into planted tree health within the St Kilda township.
The assessment identified the health of 273 trees on public land within St Kilda, finding 58.2% of these trees healthy, 27.5% stressed, and 14.3% dead. The majority of dead and stressed trees were found in the southern portion of the town.
The preliminary report identifies elevated levels of salt within the soil as a likely contributing factor to poor planted tree health. The underlying cause and timings of these elevated levels are matters that form part of the ongoing investigations, and further updates will be available in due course.
The report also identifies the need for more groundwater monitoring to be undertaken in St Kilda to better understand underlying existing groundwater and soil conditions.
Accordingly, DEM and the City of Salisbury are preparing to establish a groundwater monitoring network in the township. The purpose of this network is to monitor salinity and depth to groundwater in the St Kilda township over time; and determine if there is a risk to trees and infrastructure within the town from saline groundwater.
This update refers to a range of pond numbers and areas. For reference, the Buckland Dry Creek salt fields and sanctuaries map of the area includes guidance on pond numbers and the affected mangrove area.
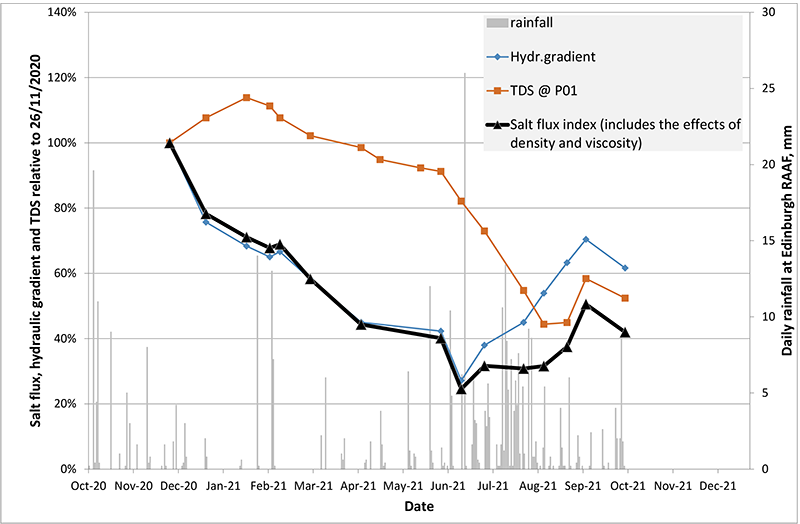
Monitoring data update
The South Australian government continues to monitor activities and environmental conditions in, and adjacent to, the Dry Creek Salt Field and take necessary actions based on the results of this monitoring.
The results of the October 2021 groundwater sampling from a section through pond PA6 (in Section 2, adjacent St Kilda) towards the mangrove boardwalk area are summarised in the graph below. Some previously reported data points have been revised due to an improved calibration factor which better accounts for the effects of density and viscosity.
These results indicate that salt flux, hydraulic gradient, and total dissolved solids (TDS) in this key monitoring location adjacent to Section 2 of the salt field (the section closest to the affected St Kilda mangroves) have all declined since the previous month.
These declines follow the anticipated increase in these measures since June 2021 over winter, and the estimated salt flux to the marsh at this location is now approximately the same as in June 2021. The declining trend evident from prior to June 2021 is expected to continue in the summer and 2022 autumn months.
Pumping from southern ponds
Since early August 2021, site operator Buckland Dry Creek Ltd (BDC) has pumped approximately 10 megalitres of brine out of ponds PA6, PA7, PA8, and PA9 (within Section 2). These are the ponds adjacent to the impacted St Kilda mangrove boardwalk area.
This pumping has not removed salt from Section 2 entirely. However, it has moved brine away from the existing impact area and further south to pond PA10.
The South Australian government continues to closely monitor management of the southern ponds, and assess risk based on data collected from the piezometer network and surface water habitats across the saltmarsh and mangrove area throughout Section 2. Based on current monitoring, it is not proposed for the government to initiate additional pumping from the southern ponds at this time.
Pumping from northern ponds
Brine from the northern ponds continues to be pumped into the nearby SA Water Bolivar outfall channel north of St Kilda, to dilute the concentration of salt and safely release it back to the marine environment. This action is being taken as part of BDC's management of the salt field and aims to establish environmental stability for the pond ecosystems for the short-term.
Approximately 2.4 gigalitres of brine from the northern ponds (Section 3) of the salt field has now been discharged through the Bolivar outfall channel since BDC commenced pumping on 29 May 2021. This has returned the salinity in Section 3 to historical operating levels.
As part of monitoring of the northern ponds, the South Australian government is aware of erosion in sea walls in Section 3. This issue has not resulted in any loss of brine from the ponds. BDC has submitted an erosion management plan and is currently implementing a works program for remediation and maintenance of the sea walls. This work has commenced.
Recent mangrove tree impact
Government is aware of isolated mangrove impact recently identified at St Kilda. Community members have also shared their environmental concerns regarding this matter which is acknowledged and appreciated.
Due to the sensitivity of the environment and the lengthy recovery period required for ecosystem restoration, it is not unexpected to observe isolated areas of impact within the impacted area. However based on the current monitoring and data, the government does not expect to observe any new significant dieback areas outside the affected area.
Planted tree health within St Kilda
The South Australian government has commissioned a study to assess planted tree health within St Kilda. This study commenced on 20 August 2021 and is seeking to determine the cause or causes of damage to dead and distressed trees in the town. The study will also provide advice on necessary further action and next steps.
It is anticipated the study will be completed in November 2021. Findings of the study will be made publicly available.
St Kilda residents were recently provided with a community update regarding Section 2 pond levels, use of the SA Water Bolivar outfall channel, and upcoming vegetation and groundwater programs within the town.
The update was placed in letterboxes in the St Kilda area, and is also available for download:
Update to hydrogeology analysis
An update has been made to analysis of the hydrogeology of the Dry Creek salt fields, and groundwater and salt flow towards the mangroves.
This update is an extension to analyses presented in the 27 August 2021 and 5 July 2021 updates on this webpage. It broadens these previous analyses to data from July and August this year, with the following findings:
- The hydraulic gradient driving groundwater towards the marsh has decreased by approximately 40% since November 2020
- The salt flux towards the marsh has decreased by approximately 35% since November 2020
- The estimated salt flux in August 2021 is less than half of what it was in November 2020, despite an increase in hydraulic gradient between June and August 2021.
Media statement
The following media statement regarding recent activity at the salt fields was released by DEM on 1 September 2021.
The Government regulators have provided Alliance members with the most up-to-date monitoring data and peer-reviewed science, which shows the significant improvements at the site, and outlined why pumping is not recommended adjacent to the impacted mangroves. These are all publicly available for anyone to see on the regulators’ websites.
The best scientific advice is that recent winter rains pose no additional risk to the area, and there is no evidence of any new impacts on the mangroves. The Government continues to monitor the site, including through its groundwater monitoring network which is showing significant improvements.
Over 1.7 billion litres of brine has been safely discharged from the ponds to the North of St Kilda through the Bolivar outfall, reducing salinity from 300 parts per thousand to 187 parts per thousand. It is expected that salinity will continue to decrease towards historical levels of 125 to 175 parts per thousand in coming months.
Scientific assessments are showing positive signs for the affected mangrove sites.
The size of the area impacted at the St Kilda salt fields and mangroves sites is less than first thought according to the latest scientific assessments released today.
Scientific monitoring also shows the site has stabilised with reduced salinity levels, resulting in an overall improvement to the site.
Independently peer-reviewed high-resolution imagery to map the area of impacted mangrove and samphire over time has been able to show that the total impacted area reported in January 2021 has been revised down from 45 hectares to 24 hectares. This includes nine hectares of mangrove dieback and 10 hectares of saltmarsh dieback.
The assessment has also shown that there has been no significant increase in dieback between December 2020 and July 2021, and that there is high confidence that no major areas of dead vegetation remain undetected.
Do winter rains mobilise salt, increase salinity levels and threaten further damage to planted tree health to St Kilda mangroves?
Government agencies continue to monitor the piezometer network and surface water habitats across the saltmarsh and mangrove area. There is no current evidence of any new leakage or movement of hypersaline groundwater into the saltmarsh following the partial filling of Section 2 ponds from 2021 winter rains.
The difference in groundwater elevation (hydraulic gradient) beneath salt pond PA6 (the closest pond to the St Kilda visitors centre) and the affected mangroves has significantly reduced. A reduction in hydraulic gradient indicates a decreased flow of groundwater and salt from beneath pond PA6 to the mangrove and salt marsh areas. So there is no indication at this stage that winter rains will cause any further impact to the mangrove area.
To June this year, the hydraulic gradient between Pond PA6 and the affected areas of mangroves and saltmarsh was less than half of what it was in November 2020.
The graph below shows density corrected groundwater heads from the local piezometer network in the vicinity of PA6. The reduction in hydraulic gradient is shown by the decreasing difference between the red (western pond) and green (marsh wells) lines on the graph.
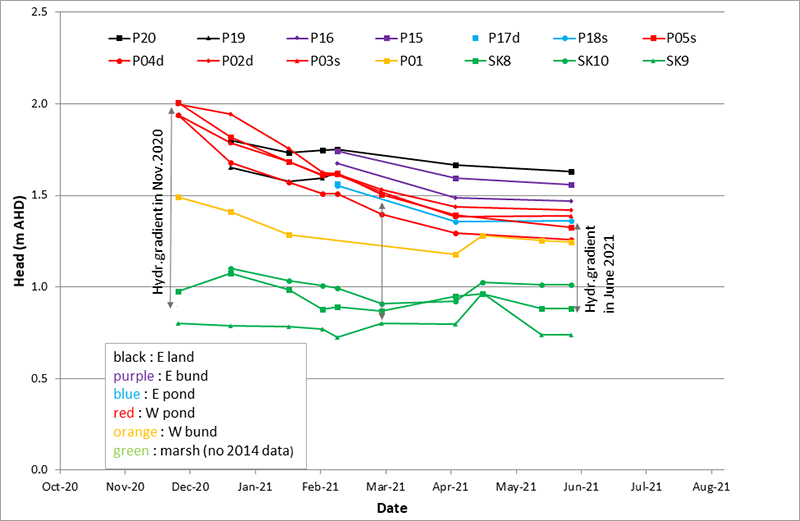
In the winter months, rainfall will likely cause the hydraulic gradient to vary. Further monitoring will be undertaken to confirm salinity trends. It is expected the hydraulic gradient will continue to decline as:
- St Kilda winter rainfall recharge to groundwater is considerably less than recharge from operational salt ponds
- the brine level in the ponds will have less relevance to the underlying groundwater heads as the gypsum seal in the ponds is re-established, and
- the influence of tidal movements increases as the groundwater head declines.
The South Australian Government continues to monitor and assess salinity trends to examine optimal water balance across the ponds to inform future actions to reduce the risks of additional vegetation impacts.
The South Australian government values the efforts that have been taken by the community to maintain attention on this issue. The Government will continue to inform and consult stakeholders as the path to restoration continues.
How are northern pond salinity levels being managed?
Brine from the Dry Creek Salt Field is being pumped into the nearby SA Water Bolivar outfall channel north of St Kilda, to dilute the concentration of salt and safely release it back to the marine environment. This action is being taken as part of the operator’s (Buckland Dry Creek [BDC]) management of the salt field. It aims to establish long-term environmental stability for the pond ecosystems.
This activity recommences pumping and flows that occurred previously between 2014 and 2019.
The pumping of brine is being undertaken by salt field operator BDC as an interim measure until the long-term future of the area is determined. It will:
- allow Dry Creek Salt Field brine to be diluted and safely released back to the ocean
- help manage pond water levels and salinity in the northern portion of the salt field, and
- re-establish some of the water flows important for the Adelaide International Bird Sanctuary.
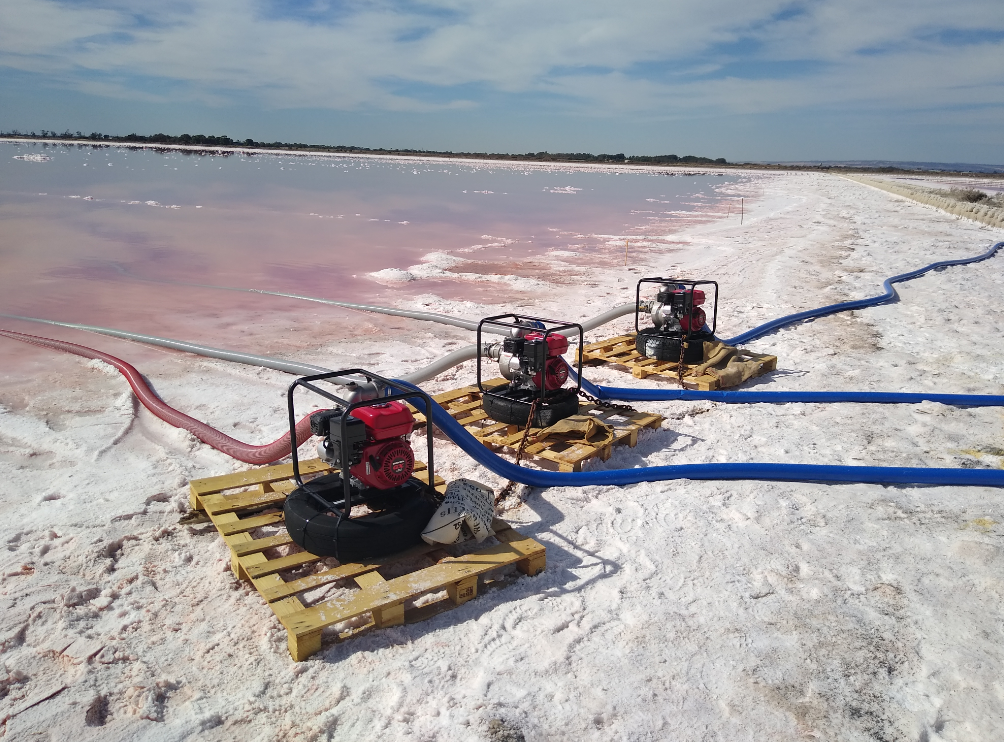
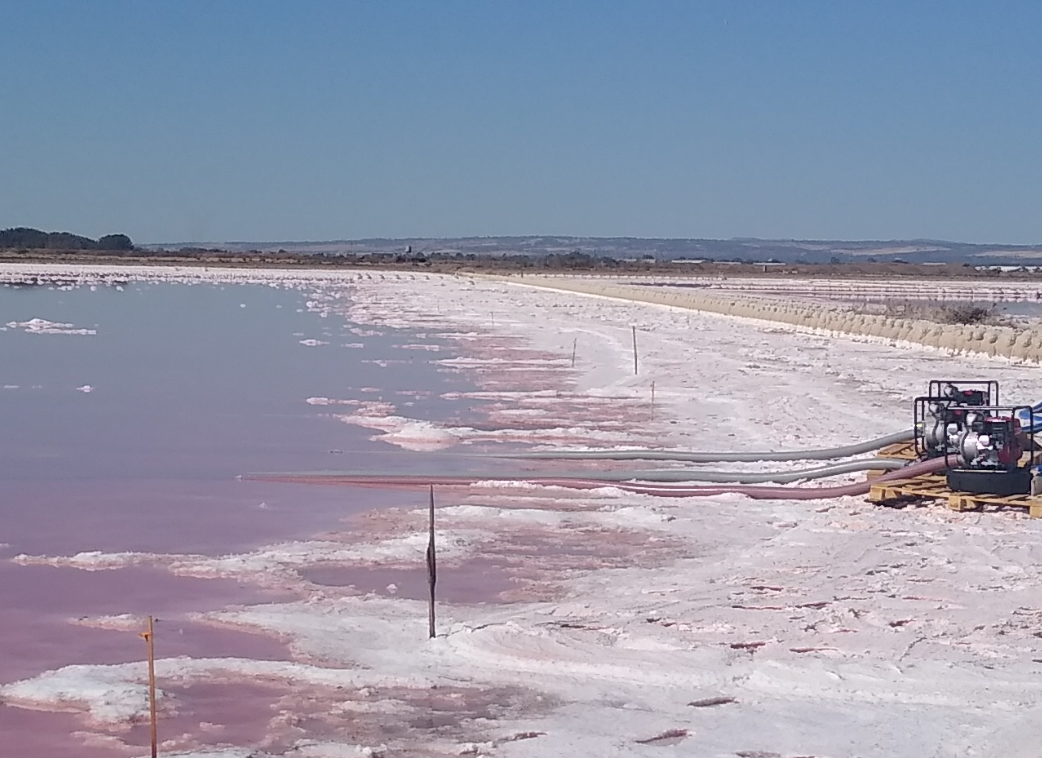
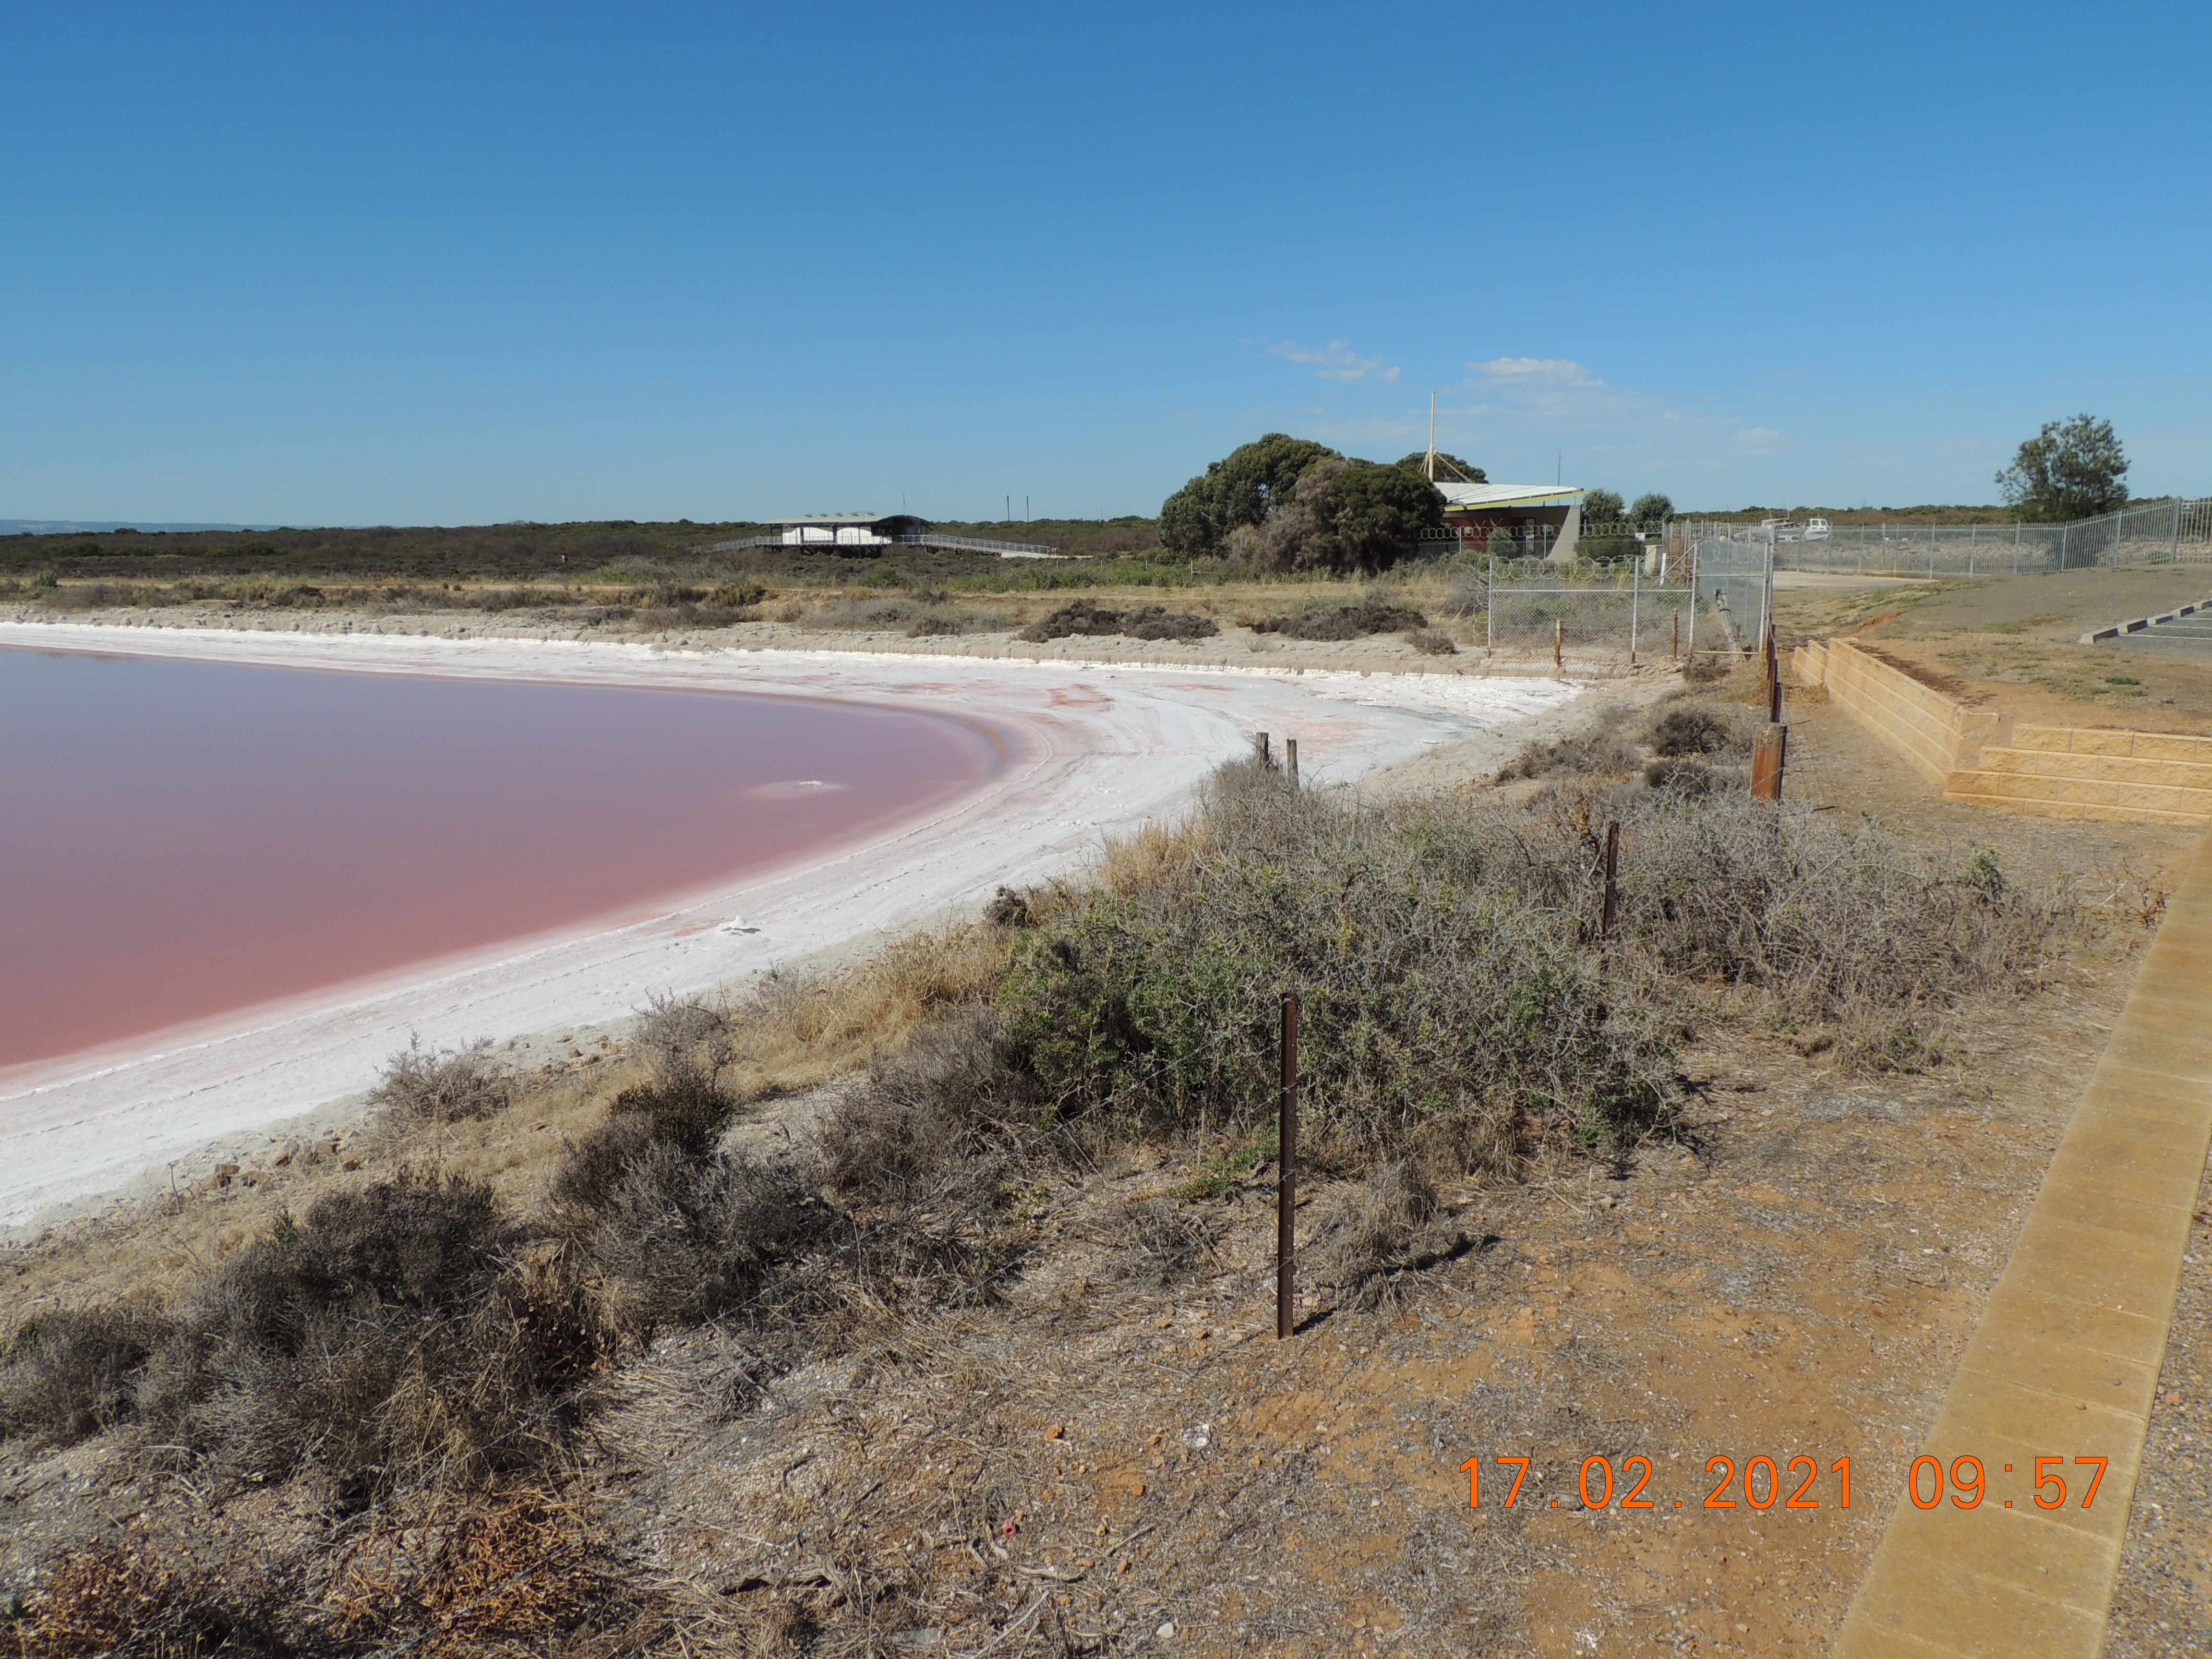
Using a combination of existing and new infrastructure, brine from the northern portion of the salt field (also referred to as Sections 3 and 4) is being pumped to the channel from the southern end of Pond PA5. The brine is diluted, as it flows through the Bolivar outfall channel, with treated wastewater from the Bolivar Wastewater Treatment Plant’s normal operations, before being safely discharged into Gulf St Vincent. The following photos show the process of water movement from the salt field to the channel and into the gulf.
What is being done to investigate groundwater and planted tree health in St Kilda township?
The Government of South Australia is committed to better understanding any potential impacts associated with the movement of saline groundwater from BDC salt field towards the St Kilda township.
As a preliminary measure, the Department for Energy and Mining has commissioned a technical review into possible causes and impacts of vegetation damage within the St Kilda township. Findings from this study will be made publicly available and will inform any potential future activities within St Kilda.
Government is also in the process of commissioning a groundwater monitoring program within the St Kilda township to better understand groundwater height and salinity in this area.
Scientific reports on vegetation dieback
The Department for Environment and Water (DEW) has developed a mapping methodology to measure the extent and composition of native vegetation impacted in the St Kilda dieback event of late 2020.
Approximately 9 hectares of mangrove, 10 hectares of saltmarsh, and nearly 5 hectares of bare, sparsely vegetated, or aquatic ecosystems within the Adelaide International Bird Sanctuary National Park - Winaityinaityi Pangkara (AIBS) at St Kilda have been impacted.
The Vegetation dieback extent and composition map - March 2021 is available on the DEW website.
There is high confidence that no major areas of dead vegetation remain undetected based on the new mapping.
Further information can be accessed in the scientific reports and online data viewer also available on the DEW website.
Government regulators continue to monitor the piezometer water monitoring network and surface water habitats across the St Kilda saltmarsh and mangrove area. Government regulators have not seen evidence of any new leakage or movement of hypersaline groundwater into the saltmarsh following the partial filling of Section 2 ponds from the recent winter rains. Scientific monitoring is showing positive changes in the groundwater to the pond and the affected mangroves.
The regulators have taken prompt action which has successfully stabilised the site. Scientific monitoring is ongoing and regulators can respond should there be any evidence of risk to the environment. This stabilisation of the site will allow for the restoration of the affected area over time.
The St Kilda area has been historically impacted by salt due to its location. Government agencies met with residents of the St Kilda area, and continue to undertake monitoring of the area.
On Tuesday 25 May 2021 representatives from the South Australian government provided a briefing to the City of Salisbury on recent government actions around the Dry Creek salt fields and St Kilda mangroves.
Attended by elected members and Council staff at the City of Salisbury Council Chambers, the briefing included information on current water quality monitoring and vegetation mapping at the site. Copies of the presentations that were delivered on these topics at the briefing are provided below.
- St Kilda monitoring and pumping programs (PDF, 1.0 MB)
Manager Environmental Science, Environment Protection Authority - Hydrogeology of the Dry Creek Salt Fields and Groundwater Flow Towards the Mangroves of St Kilda (PDF, 1.1 MB)
Principal Mining Assessment Officer, Department for Energy and Mining
It is expected that similar briefings will occur as work continues on the remediation and rehabilitation of the area.
The State Government has ceased its pumping activity at the St Kilda salt fields, following significant movement of water and reduced leakage into the most affected mangroves and saltmarsh areas.
In the time the pumps were on site, their activity together with enhanced evaporation contributed to reducing the volume of hypersaline water in Pond 6 by approximately 55 million litres. Analysis of piezometer data in the area suggests there is now reduced leakage into the most damaged area of saltmarsh adjacent to Pond 6, but further monitoring is required to confirm that this pattern is maintained.
The activity demonstrated that the six portable transfer pumps were able to move substantial volumes of water around the salt field and contribute to stopping further harm to the mangrove environment.
Work is continuing to stop further impact, promote conditions for recovery, and establish long term environmental stability for the mangrove and wider ecosystem.
Department for Environment and Water (DEW) and City of Salisbury Workshop
DEW have published a summary of a workshop held in March with the City of Salisbury and key researchers and community members. Visit the Department for Environment and Water webpage for further details of the workshop and to download the workshop summary.
Pond levels adjacent to the affected mangroves have continued to recede and piezometer data is showing positive progress as Buckland Dry Creek Ltd (BDC) and the state government continue pumping activity at the site.
Since the issuing of the Clean Up Authorisation (CUA) (PDF, 7.3 MB) in March, six portable transfer pumps have been installed in targeted areas of ponds PA6 and PA7. These pumps are pumping hypersaline brine away from the western bund wall of both ponds and to dry areas of the ponds to accelerate evaporation, and provide flexibility to ensure that pond levels are lowered efficiently. The pumps are in addition to pumping equipment that was operating at the site prior to the CUA.
The process has been successful in reducing the volume of water in both ponds, and made the shallower pond edges more susceptible to evaporation. There has also been a significant decrease in groundwater pressure since the process began, based on the piezometer series in the target ponds.
At the start of Easter the portable pumps had pumped over 16 million litres of water, equal to more than six Olympic sized swimming pools.
By the middle of April over 35 million litres of hypersaline brine is expected to have been pumped at the site. This represents approximately half the volume of brine that was estimated to be held in PA6 at the start of the pumping program.
The state government continues to monitor progress with BDC to ensure that pumping occurs as quickly as is reasonably practical, while considering the varying pond depths and existing infrastructure and only undertaking activity with consideration of the wider environment.
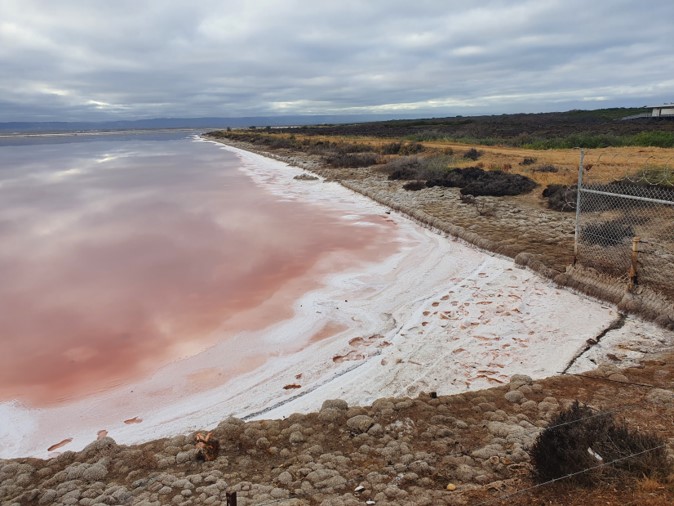
NW corner of Pond PA6 looking SE on 23 March 2021
Drone image of Pond PA6 looking south on 28 January 2021
The Department for Environment and Water (DEW) has published an update on their website regarding a joint DEW and Salisbury Council Workshop held during the first week of March with attendees from state and local government, the local community and academia.
Visit the DEW website to read the update: https://www.environment.sa.gov.au/topics/coasts/st-kilda-mangroves
Pumping of hypersaline water continuing
Following the Environmental Direction (PDF 468.1 KB) issued by the Department for Energy and Mining (DEM) on 24 December 2020, Buckland Dry Creek Ltd (BDC) is continuing pumping to remove hypersaline water from the ponds adjacent to the affected mangroves. The state government is also assisting by installing additional pumps to accelerate the movement of water, through the Clean Up Authorisation (PDF 7.3 MB) issued under the Environment Protection Act 1993.
DEM is monitoring progress with BDC so that pumping occurs as quickly as is reasonably practical, while considering the varying pond depths and existing pond infrastructure, and only undertaking activity with consideration of the wider environment.
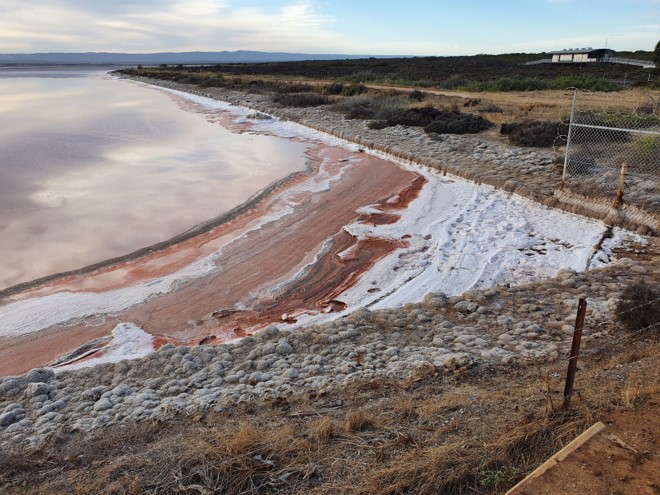
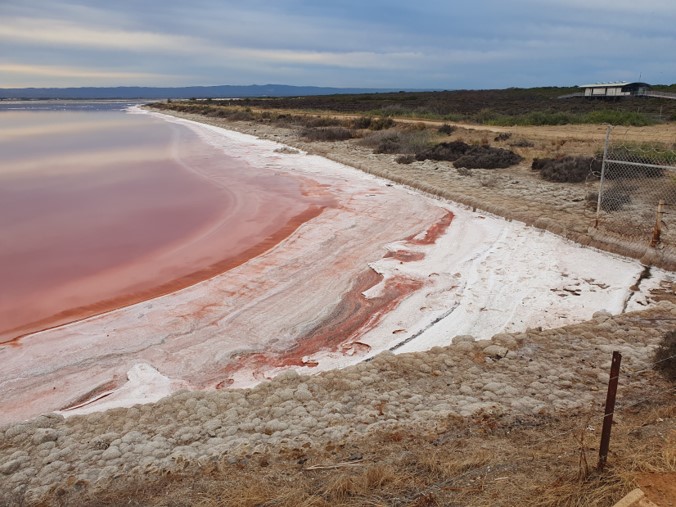
The following images show the reduction in level of pond PA6 over time. Pond PA6 is adjacent to the affected mangroves and the images are taken at the northwest corner of the pond.
Click on the images to view a larger version of the image.
As part of a coordinated state government response, the Department for Energy and Mining (DEM) is stepping up site activities this week to prevent further harm to the St Kilda mangroves.
The state government will install additional pumps to accelerate the movement of water at the Dry Creek salt fields. This will assist the existing actions being taken to prevent further environmental harm to the mangrove environment adjacent to the Dry Creek salt field.
This activity has been made possible through a Clean Up Authorisation (CUA) (PDF, 7.3 MB) under the Environment Protection Act 1993.
The CUA comes after successful government trials of new pumping equipment at the site last week and enables Environment Protection Authority (EPA) Authorised Officers to undertake water pumping on the salt field site and to recover costs from the company. The pumping is expected to continue for a number of months.
This work will complement activity that is already being undertaken by licensee Buckland Dry Creek (BDC), following directions previously issued by DEM.
Experts from DEM, the Department for Environment and Water (DEW), the EPA and external consultants continue to collaborate to stop further environmental harm to the mangrove environment and promote conditions for recovery of the impacted area.
DEM regulates the site under the Mining Act 1971 through the mining lease it holds with BDC.
BDC also has a license under the Environment Protection Act 1993 for chemical storage and warehousing facilities, chemical works (salt production) and discharges to marine or inland waters, which is overseen by the EPA.
Presentations
The following presentations provide new information about the salt fields and mangroves of St Kilda. These presentations were delivered as an update from the government to community groups and non-government organisations (NGOs) at a meeting held on Friday 5 February 2021:
- Hydrogeology of the Dry Creek salt fields and groundwater flow towards the mangroves of St Kilda (PDF, 798.4 KB)
Principal Mining Assessment Officer, Department for Energy and Mining - Impacts on mangrove and saltmarsh habitats, and pathways to recovery (PDF, 2.7 MB)
Principal Ecologist, Department for Environment and Water - St Kilda monitoring results (PDF, 1.7 MB)
Principal Aquatic Biologist, Environmental Science, Environment Protection Authority
Questions and government responses
A number of questions have been raised by community groups and NGOs regarding the Dry Creek salt fields and St Kilda mangroves. The questions and government responses (presented as they were received) are available in the following document:
Peizometer data
Data from the peizometer network around the St Kilda mangroves and the salt fields is available for public access via the WaterConnect website.
The Department for Energy and Mining (DEM) understands and shares the concerns of the South Australian community on the dieback an area of the St Kilda mangroves, and has been leading a cross-government response and investigation into the causes.
Since September last year, DEM has continued its cooperation with the Department for Environment and Water (DEW) and the Environment Protection Authority (EPA) throughout this investigation into the activities undertaken on the Dry Creek salt fields.
The current investigative activities include continuing daily and weekly site inspections, monitoring and identifying options to inhibit further impacts.
Positively, the scientific monitoring demonstrates that there is a reduction in seepage of saline water and the area of impact has not expanded significantly in recent months.
The owners of the site, Buckland Dry Creek, are undertaking the immediate treatment actions directed by Government and are taking action to maintain the integrity and stability of the rest of the salt field.
The South Australian Government values community and stakeholder insights into the Dry Creek salt fields and welcomes continued engagement with local stakeholders. Further information and research, and frequently asked questions can be found below.
The Department for Energy and Mining has published the three environmental directions issued to Buckland Dry Creek Pty Ltd.
- Stop pumping water into ponds (PDF 8.4 MB): Issued 19 November 2020, this has been complied with
- Prevent further seepage at Para River (PDF 2.6 MB): Issued 10 December 2020, this has been complied with
- Remove water from the ponds south of St Kilda (PDF 468.1 KB): Issued 24 December 2020, this is in progress
- Government shares community concerns regarding the environment surrounding the salt fields, and is focused on stabilising the site as quickly as possible.
- Stablising the Dry Creek salt fields is a government priority, with several regulatory actions currently underway.
- The regulator has issued three directions to:
- stop pumping water into ponds
- prevent further seepage at Para River
- remove water from the ponds south of St Kilda
- The site operator is working to rectify the issues and is being responsive to directions from Government.
- Government regulators are actively monitoring the site, including vegetation mapping and hydrological analysis.
- Compliance actions as a result of the mangrove dieback remain subject to ongoing formal investigations.
The following activity is also occurring:
- Groundwater/hydrology
Recently collected groundwater data is reporting a reduction in seepage flow wates into the mangrove due to the reduction in pond levels from evaporation, which further supports the decision to drain the ponds - Vegetation assessment and mapping
Vegetation monitoring is ongoing. While any impact to this environment is unacceptable the area of impact has not changed significantly since November 2020. Vegetation monitoring will continue to assess the area impacted - Broader stability arrangement
The site operator is working with government towards a water management option to support overall stability of the salt fields. These arrangements are expected to be finalised in the coming weeks to manage the salinity of the salt fields
- Stabilising the Dry Creek salt fields is a government priority, with several regulatory actions currently underway.
- The company's plans to satisfy the direction issued on 24 December 2020 have already commenced with on-ground works expected early next week.
- Government regulators are actively monitoring the site, including vegetation mapping and hydrological analysis.
- Formal investigation into the cause of the mangrove dieback and any compliance actions continues.
- Government shares community concerns regarding the environment surrounding the salt fields, and is focused on stabilising the site in both the short and long term.
- Regular updates for community will be provided over the coming weeks.
An updated program for environment protection and rehabilitation for the Dry Creek salt fields was approved by the Department for Energy and Mining (DEM) on 24 December 2020, which allows Buckland Dry Creek Ltd (BDC) to reconnect Section 2 and Section 1 of the salt fields, through ML 6514. This approval enables BDC to move water within the Dry Creek salt fields which is a critical step to address impacts that have occurred in Section 2 of the salt fields. This approval does not allow the re-commencement of commercial salt production. If Buckland Dry Creek Ltd (BDC) wish to re-commence full scale commercial salt operations, a review of the program for environment protection and rehabilitation is required and would require subsequent government assessment and approval.
A Direction was issued to BDC on 24 December by DEM, which requires BDC to, as far as reasonably practical, remove brine from all ponds within Section 2 (adjacent to the impacted St Kilda Mangroves) to Section 1 of the Dry Creek salt fields, and prevent brine from Section 3 entering Section 2 of the salt fields. To ensure ongoing stability of the salt fields, Government have engaged with SA Water to enable environmental movement of water from Section 3 of the salt fields (North of Section 2) to the ocean, via the Bolivar outfall. This engagement will continue in the New Year.
DEM will continue to engage with BDC over coming weeks to confirm their program of works to remove the brine from Section 2 into Section 1 of the salt fields. Government monitoring of groundwater movement and vegetation is ongoing. DEM will post a status update on the DEM website in early January 2021.
Dry Creek monitoring data update
Monitoring results to 22 March 2023 are summarised in the graph below.
The results are derived from a cross-section of salt pond PA6 at St Kilda, running from east to west into the salt marsh - the nearest transect to the impacted mangrove swamp.
Trends in the salt index
General
The Transect A salt index indicates a general decline in salt moving from the salt pond to the impacted salt marsh with seasonal variation, attributed to winter rainfall, summer evaporation and tidal movements.
Summer trends
During the summer of 2022/3, the salt index decreased from 25% to 10% due to a decreasing groundwater head difference. This is consistent with the trends observed during the previous two summers and likely due to low rainfall and high evaporation.
Comparison of end summer half-year measurements clearly show the general decline:
| Summer | Salt index | % Index reduction |
|---|---|---|
| 2021 | 50% | 50% |
| 2022 | 25% | 75% |
| 2023 | 10% | 90% |
Winter trends
During the winter of 2022, the salt index remained stable due to a combination of increasing groundwater head difference and a reduction in salinity as a result of tidal influence and winter rain dilution.
Comparison of end winter measurements indicate the salt index reduction:
| Winter | Salt index | % Index reduction |
|---|---|---|
| 2021 | 40% | 60% |
| 2022 | 20% | 80% |
Historical
From June to November 2021 the salt index remained stable due to a combination of increasing groundwater head difference and a significant reduction in salinity as a result of tidal influence and winter rain dilution.
From November 2020 to June 2021, a steep decline occurred due to significantly decreasing head difference and overall stable salinity, because of:
- cessation of brine transfers into Pond PA6 following an environmental direction under the Mining Act 1971 issued by DEM to Buckland Dry Creek Pty Ltd
- low rainfall combined with high evaporation during the summer commencing December 2020
- the EPA pumping brine from pond PA6 away from the marsh in March and April 2021 through a clean-up authorisation issued under the Environment Protection Act 1993.
DEM directions
The regulator has issued three directions:
- Stop pumping water into ponds (PDF 8.4 MB): Issued 19 November 2020, this has been complied with
- Prevent further seepage at Para River (PDF 2.6 MB): Issued 10 December 2020, this has been complied with
- Remove water from the ponds south of St Kilda (PDF 468.1 KB): Issued 24 December 2020, this is in progress
Compliance reporting
Little Para River remedial works
Scientific studies and reports
Tidal drainage report
A tidal drainage trial funded by the Department for Energy and Mining has been conducted to understand the risks and opportunities presented by tidal flows for restoration of the coastal habitat or areas of the salt field.
Pathways to tidal restoration report
In 2012, following the potential closure and decommissioning of the Dry Creek Salt Field by Ridley Corporation, the Adelaide and Mount Lofty Ranges (AMLR) NRM Board commissioned a briefing paper to outline the risks and opportunities to coastal habitat to inform decision making.
Shorebird population monitoring in Gulf St Vincent
This report provides an overview of shorebirds, habitats and counting methods, details of the 2017-18 to 2019-20 simultaneous shorebird counts and reports on training and awareness events conducted in over the past 3 count sessions.
Video: Restoration of the Dry Creek Salt Field in South Australia
This video reports on the 2018 project on restoring the Dry Creek Salt Field.
Contact for more information
For enquiries relating to the mining operation contact:
Mining Regulation
Department for Energy and Mining
Email: DEM.MiningRegRehab@sa.gov.au
Back to summary of major mineral projects and mining activities
Register your interest to receive updates
To receive updates regarding the program of works for the Dry Creek Salt Field email DEM.MiningRegRehab@sa.gov.au including the words 'Dry Creek Salt Field' in the subject line.
Aerial map: Buckland Dry Creek Salt Field and sanctuaries
The aerial map shows the vegetation impacts at the Dry Creek Salt Field.

Download a larger version of the aerial map of Buckland Dry Creek Salt Field (PDF)
St Kilda mangrove dieback
The South Australian government is aware of mangrove dieback in the vicinity of the Dry Creek Salt Field. Approximately 9 hectares of mangrove, 10 hectares of saltmarsh, and nearly 5 hectares of bare, sparsely vegetated, or aquatic ecosystems within the Adelaide International Bird Sanctuary National Park - Winaityinaityi Pangkara (AIBS) at St Kilda have been impacted. Any impact is unacceptable.
Experts from the Department for Energy and Mining, the Department for Environment and Water, the Environment Protection Authority and the University of Adelaide, along with external consultants, are collaborating to:
- stop further impact
- promote conditions for recovery of the affected areas, and
- establish long term environmental stability for the mangrove and wider ecosystem.
Updates on the steps being taken to address the mangrove dieback are detailed below. This webpage will be regularly updated as further information is available.
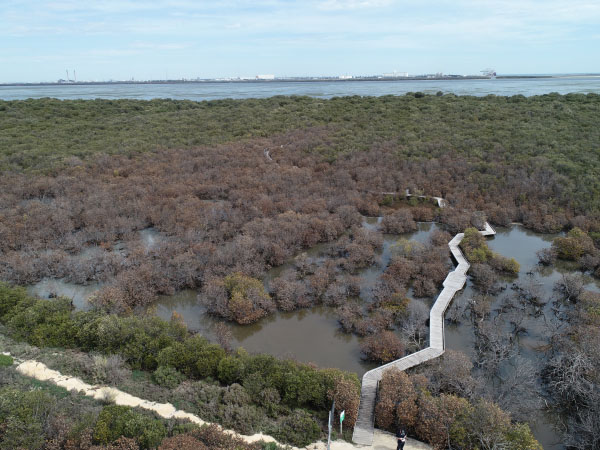
Aerial view showing damage to St Kilda mangroves, September 2020
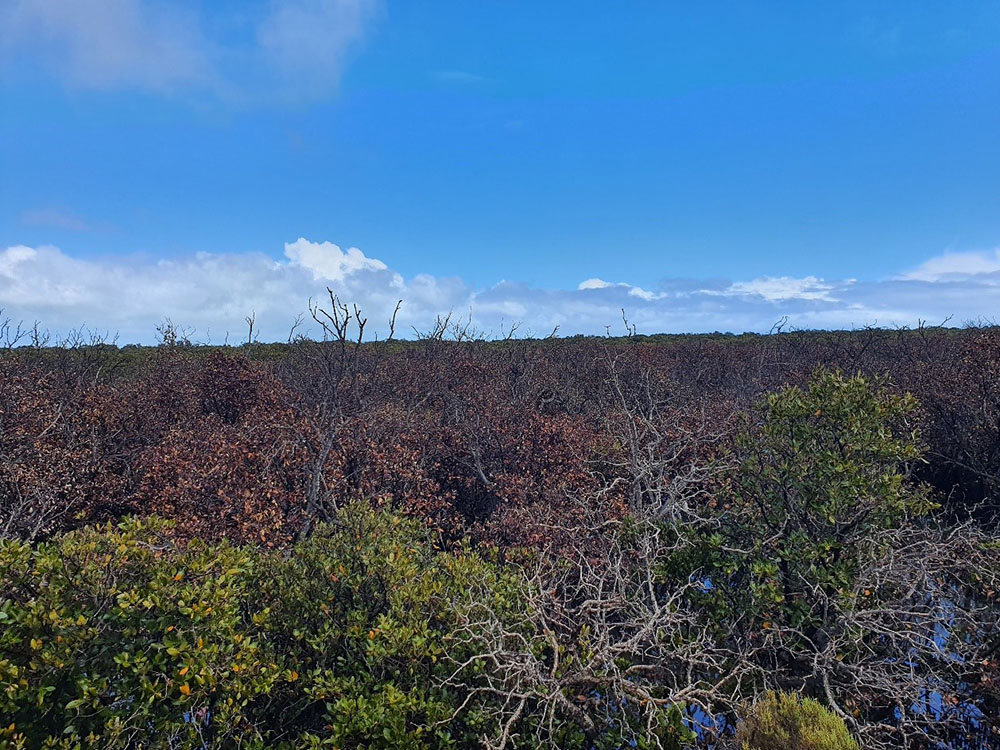
Damaged and dying mangroves, December 2020
Cross-agency collaboration
The Department for Energy and Mining, the Department for Environment and Water, and the Environment Protection Authority (EPA), are working together to understand how to most effectively promote conditions for recovery of the affected areas and establish long term environmental stability for the mangrove and wider ecosystem.
The EPA is assisting with scientific advice, water sampling and the installation of a piezometer network to collect information on groundwater levels around the ponds. Advice and data will be used to support the whole of government team in assessing the environmental impacts and determining what actions need to be taken to prevent further damage to the natural environment and implement works aimed at rehabilitating the affected area. The diagram below shows the Groundwater Piezometer network at the St Kilda mangroves. which are being used to collect data on groundwater levels. Ten new piezometers, as well as those already existing on site, are being used to collect data on groundwater levels, which will be used to support the appropriate stabilisation actions to be undertaken.
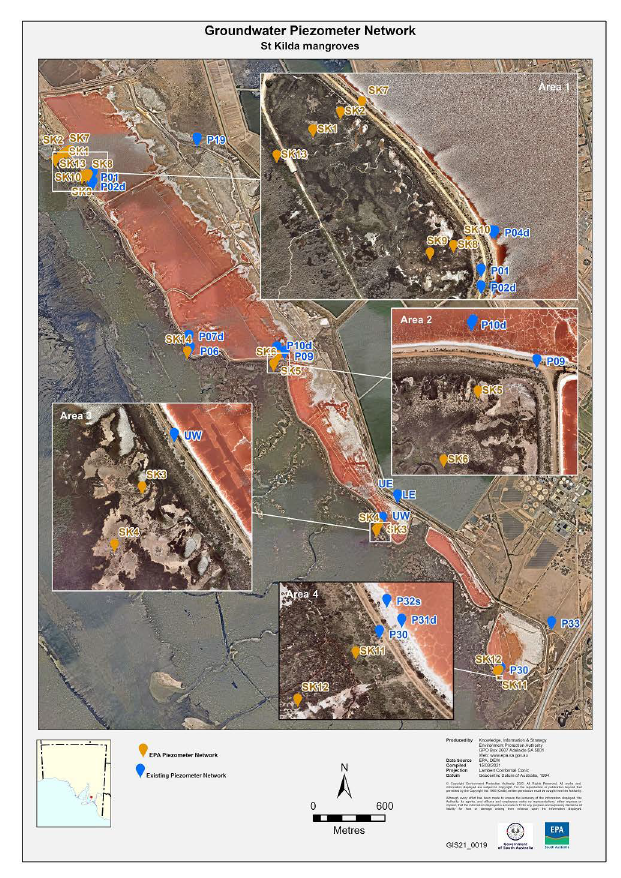
Community engagement
Government is committed to ensuring that interested people and the local community are updated and contributing input to the coordinated response that is underway. A number of activities have already been undertaken by government to update and engage with the community and seek their contributions. This has included:
- workshops with community groups and non-government organisations (NGOs), including members of the St Kilda Mangroves Alliance
- meetings with concerned community members
- progress update meetings with local councils
- responses to questions lodged by community groups and NGOs
- a dedicated webpage providing regular updates, regulatory documents and reports including the program for environment protection and rehabilitation for the tenement holder, updated directives relating to the salt field, compliance reports, and scientific studies and reports
- providing access to piezometer (an instrument used to monitor the pressure or depth of groundwater) data from across the site through the WaterConnect website.
These and other activities will continue as the response and rehabilitation efforts progress over the coming months.
Frequently asked questions
- The Dry Creek Salt Field is an area of evaporation ponds stretching more than 30 kilometres along the metropolitan coast from Dry Creek to Middle Beach, which is primarily regulated under the Mining Act 1971 by the Department for Energy and Mining, as well as under other key state and Commonwealth environment law.
- When in operation, sea water is pumped into ponds at the northern end of the salt field, then gradually moved south with salinities increasing through evaporation, until salt is precipitated in the crystallisers adjacent to Port Wakefield Road at Dry Creek, dried and harvested.
- It is an environmentally complex legacy industrial site comprising a coastal location surrounded by sensitive habitats, including Adelaide International Bird Sanctuary National Park - Winaityinaityi Pangkara and immediately adjacent to commercial and residential population centres.
- After more than 70 years of commercial salt production to support glassmaking and other industrial uses, operations were suspended in 2014 when the sole customer for the site - the Osborne soda ash plant - ceased operations.
- The current site owner, South Australian company Buckland Dry Creek Pty Ltd, purchased the site in 2015, including the obligation to manage the site in accordance with environmental management plans.
- The state and federal governments continue to oversee an ongoing requirement for the site owner to carefully manage both the man-made and natural aspects of the salt field.
- After decades of salt production, closure of the immediate market for the salt resulted in the site being put in 'care and maintenance', which included a holding pattern designed to manage environmental risk, and the rehabilitation of some areas at the southern end of the salt fields for future land uses.
- In December 2019, Buckland Dry Creek began moving water around the salt field in response to challenges with the sustainability of the holding pattern, which was established in 2014 to manage environmental risk.
- The holding pattern involved the pumping of seawater in the north of the salt field, circulation through filled ponds to the south, then discharge and dilution of the now-hypersaline water using the Bolivar Waste Water Treatment Plant marine outfall channel.
The Department for Energy and Mining is the lead regulatory agency and regulates the site in accordance with the Mining Act 1971. Other agencies are integral to management of the site including:
- The Environment Protection Authority, which regulates the salt fields under the Environment Protection Act 1993.
- The Department for Environment and Water, which oversees native vegetation management under the Native Vegetation Act 1991 and manages the Adelaide International Bird Sanctuary National Park - Winaityinaityi Pangkara.
- The Commonwealth Department of Agriculture, Water and the Environment which regulates the site as one of National Environmental Significance under the Environment Protection and Biodiversity Conservation Act 1999.
- Portions of the mangroves and samphire communities close to the boardwalk at St Kilda, and further south next to the salt ponds PA 6, 7,8, and 9 are experiencing dieback.
- The Department for Energy and Mining, the Department for Environment and Water, and the Environment Protection Authority are working collaboratively to investigate the cause of the dieback. Based on an independently peer-reviewed process, approximately 24 hectares of vegetation dieback has been mapped using new high-resolution multispectral aerial imagery captured in March 2021. This includes 9 hectares of mangrove, 10 hectares of saltmarsh, and nearly 5 hectares of bare, sparsely vegetated, or aquatic ecosystems within the Adelaide International Bird Sanctuary National Park - Winaityinaityi Pangkara.
- The mapping showed no major increase in dieback extent was evident between December 2020 and July 2021.
- Working with site operator Buckland Dry Creek Ltd (BDC), the government assessment team is conducting surveys, and undertaking environmental testing and monitoring, to ensure actions prevent and mitigate further environmental harm.
- While thorough investigations and science take time to identify causes, immediate measures have been implemented, including the pumping of water from the ponds adjacent to the impacted St Kilda vegetation.
- Government is committed to ensuring BDC meets the required environmental outcomes and statutory obligations including:
- Minimise further impacts
- Promote recovery of vegetation
- Ensure ongoing stability of the salt fields
- Assessments of the dieback are being jointly conducted by the Department for Energy and Mining (DEM), the Environment Protection Authority (EPA), and the Department for Environment and Water (DEW). Experts from the University of Adelaide are also assisting.
- The EPA is also conducting a formal investigation into whether the operator’s actions at the site constitute an offence under the Environment Protection Act in relation to the mangrove dieback. In addition, DEM has issued three Environmental Directions to site operator Buckland Dry Creek Ltd (BDC) and required amendments to the frequency and content of its regulatory compliance reporting.
- The main outcome of two of the Environment Directions was to stop any further water being added to the ponds adjacent to the impacted St Kilda vegetation, and to remove water from the seven kilometres of ponds adjacent the St Kilda area.
- Under these Directions, millions of litres of brine were pumped away from the relevant ponds at St Kilda, reducing the impact on local groundwater conditions and improving the environment required to support the future recovery of the impacted area.
- Regulators continue to work with BDC on the response to the observed impacts, to prevent further impacts and to re-stabilise the salt field.
- The third Environment Direction related to brine seepage adjacent the Little Para River, at the southern end of the fields. This Environmental Direction was issued on 10 December 2020 and the required works were completed the following week.
- The company does not have authorisation to resume commercial salt operations, and any renewed salt harvesting will require new approvals including impact assessments, detailed mine plans and operator capability assessments.
- There are two government processes under way. There is a cross-government scientific effort to better understand the site, the causes of the harm to vegetation, and actions to mitigate risk, and an Environment Protection Authority (EPA) investigation as to possible offences under the Environment Protection Act (EP Act).
- The EPA investigation into whether the operator’s actions at the site constitute an offence under the EP Act in relation to the mangrove dieback is ongoing. As standard practice, the EPA does not release details of its investigations until any legal processes have been concluded.
- With respect to understanding the site and the dieback of vegetation in 2020, the government assessment has multiple elements and is considering various impacts and a range of possible causes over what is a large and complex site. It includes scientific monitoring and assessments of site conditions, and potential causes and contributing factors to the dieback.
- The monitoring is being undertaken over time to ensure that datasets of vegetative and other environmental receptors are representative, sufficient, and robust.
- The scientific assessment has collected and continues to collect evidence from multiple entities and individuals, including subject matter experts. Evidence is being gathered from a diverse range of sources and datasets to ensure a full interrogation of potential cause and impacts.
- The Department for Energy and Mining is the lead regulator under the Mining Act 1971 for the Dry Creek Salt Field. The EPA is the lead agency under the Environment Protection Act 1993, which regulates discharges to marine or inland waters associated with salt production, and monitors compliance with the conditions of EPA Licence Number 40942 for the site. The Department for Environment and Water oversees native vegetation management under the Native Vegetation Act 1991, including some areas of adjoining habitats such as the estuarine nurseries and the Adelaide International Bird Sanctuary.
- Government regulators have a full suite of compliance tools that can be used. Site operator Buckland Dry Creek Ltd has implemented the actions required of the Environmental Directions issued by government to date, and these actions continue.
- If investigations determine that further action under the relevant laws is warranted, those actions will be taken.
- Once the hydrological conditions improve, it is anticipated that the environment will recover naturally, however there will be opportunities to assist that recovery.
- A working group has been established with community members, the Department for Environment and Water and the City of Salisbury to look at opportunities to accelerate recovery and restore other areas in the vicinity to improve the environmental resilience of the area.
- The enduring stability of the environment, including the salt field and mangrove and samphire eco-systems, is a priority for the South Australian government.
- The government continues to actively regulate the salt field. It is an environmentally complex legacy industrial site comprising a coastal location surrounded by sensitive habitats, and immediately adjacent to commercial and residential population centres.
Information about the Dry Creek Salt Field operation
The Dry Creek Salt Field is operated by Buckland Dry Creek Pty Ltd for the purpose of mining salt (sodium chloride).
The operation is currently in care and maintenance - holding pattern, evaporation ponds
Mining operation
After more than 70 years of production, the Dry Creek Salt Field ceased producing salt in 2014 following the closure of Penrice’s Osborne soda ash production plant.
The salt field presents a complex environment due to its size, densely populated coastal location, and co-existence with surrounding sensitive environments such as the Adelaide International Bird Sanctuary, the Dolphin Sanctuary, and other fauna and flora with mangroves having grown ever closer. These habitats are of high conservation value and as such are protected under State, National and International programs.
Following a series of environmental investigations, selected ponds across the salt field were allowed to dry, with the remaining ponds put into a 'holding pattern' to prevent impacts to the surrounding environment while longer term solutions were investigated.
The sale of the salt field to Buckland Dry Creek Pty Ltd (BDC) saw acceleration of the reclamation of land at the southern end of the salt field for potential future development. BDC are also assessing long-term end-use options for the remaining areas incorporating development and conservation, and whether there is a commercial and environmentally sustainable opportunity by recommencing salt production.
To enable mining operations for salt production, a revised program for environment protection and rehabilitation (PEPR) would need to be prepared by BDC and submitted to the Department for Energy and Mining for assessment. A PEPR review would be based upon a risk assessment and would set out the environmental outcomes that must be met by BDC. The PEPR would also contain detailed development plans on the operations, production rates, processing methods, rehabilitation and closure plans. As part of the assessment process, appropriate consultation on the PEPR is required.
Location and area
The Dry Creek Salt Field is an area of evaporation ponds stretching over 30 kilometres along the coast from Dry Creek to Middle Beach covering an area of approximately 5,500 hectares.
Download map showing Dry Creek Salt Fields (PDF, 4.8 MB)
Tenement information
Dry Creek Salt Field consists of mining leases and private mines as follows:
- Mineral lease (ML) 234, 235, 237, 357, 358, 359, 360, 361, 389, 390, 391, 392, 404, 405, 406, 416, 417, 418, 421, 429, 439, 440, 441, 442, 443, 444, 445, 446, 447, 448, 587, 600, 605, 606, 607, 608, 617, 618, 702, 5205, 5206, 5207, 5208, 5209, 5210, 5908, 6514
- Private mine 199 and 248
Operations commenced in 1940.
Regulatory documents and reports
Integrated program for environment protection and rehabilitation (PEPR) and mine operations plan (MOP)
The program for environment protection and rehabilitation December 2024 approved on 25 June 2025 is the approved program for the site.
DEM directions
The regulator has issued three directions:
- Stop pumping water into ponds (PDF 8.4 MB): Issued 19 November 2020, this has been complied with
- Prevent further seepage at Para River (PDF 2.6 MB): Issued 10 December 2020, this has been complied with
- Remove water from the ponds south of St Kilda (PDF 468.1 KB): Issued 24 December 2020, this is in progress
Compliance reporting
- Annual compliance report for holding pattern and residual operations 2019–2020 (PDF 99 MB)
- Annual compliance report 2023-2024 (19 MB)
- Annual compliance report 2024-2025 (17 MB)
Little Para River remedial works
Scientific studies and reports
Tidal drainage report
A tidal drainage trial funded by the Department for Energy and Mining has been conducted to understand the risks and opportunities presented by tidal flows for restoration of the coastal habitat or areas of the salt field.
Pathways to tidal restoration report
In 2012, following the potential closure and decommissioning of the Dry Creek Salt Field by Ridley Corporation, the Adelaide and Mount Lofty Ranges (AMLR) NRM Board commissioned a briefing paper to outline the risks and opportunities to coastal habitat to inform decision making.
Shorebird population monitoring in Gulf St Vincent
This report provides an overview of shorebirds, habitats and counting methods, details of the 2017-18 to 2019-20 simultaneous shorebird counts and reports on training and awareness events conducted in over the past 3 count sessions.
Video: Restoration of the Dry Creek Salt Field in South Australia
This video reports on the 2018 project on restoring the Dry Creek Salt Field.
Contact for more information
For enquiries relating to the mining operation contact:
Mining Regulation
Department for Energy and Mining
Email: DEM.MiningRegRehab@sa.gov.au
Back to summary of major mineral projects and mining activities