
The Department has prepared a range of seismic mapping products on a regional basis for major South Australian basins available for viewing and/or purchase.
Products are available for the following prospective petroleum basins:
Input data for these projects has been derived from a range of sources, including well tops, water bore information, processed seismic data and open file company interpretations.
Petrosys mapping and interpretation software were utilized in all gridding, contouring and data presentation. In general output products comprise Time, Depth and Isopach data for key seismic marker horizons.
Georeferenced tif images of many of these horizons are promoted for viewing through SARIG to highlight extent of coverage and detail. These can be downloaded as georeferenced tif images.
Grids, contours, polygon and fault files and other format files are available on request.
Arckaringa Basin mapping products
Data and interpretation from the 2014 Arckaringa Basin Seismic Mapping project are available in ASCII, Petrosys and Shapefile formats on SARIG.
Featured map
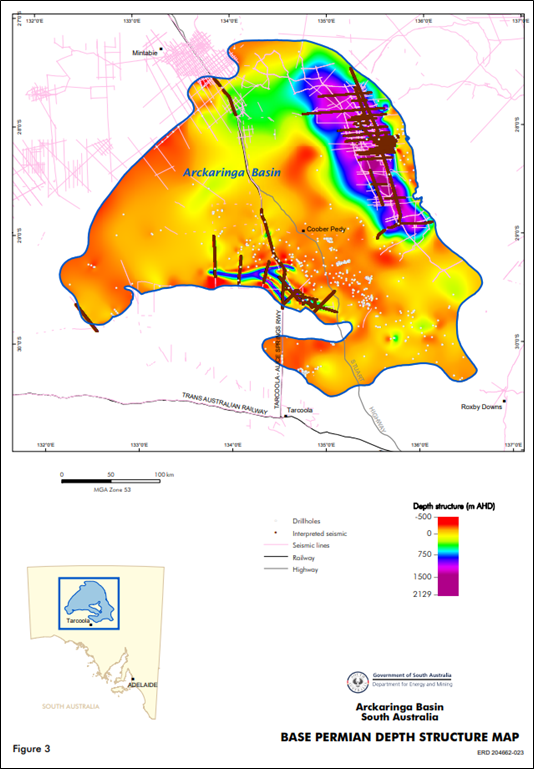
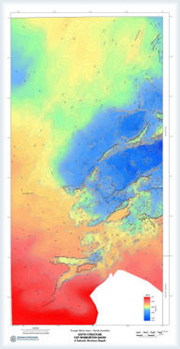
Base Permian depth structure map in the Arckaringa Basin
Cooper and Eromanga Basin mapping products
Mapping was conducted by DEM in South Australia, Northern Territory and parts of Queensland and New South Wales to produce a series of depth structure maps of key aquifers and aquitards that would be incorporated into a transient groundwater model of the South Australian portion of the Great Artesian Basin (GAB) developed by the South Australian Department for Environment and Water (DEW) in conjunction with DEM.
Depth maps:
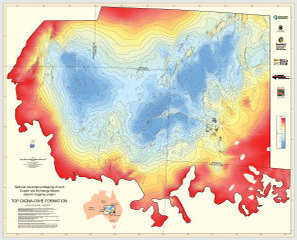
- Top Cadna-owie - “C” horizon
- Top Murta - “DM” horizon
- Top McKinlay - “McK” horizon
- Top Namur - “DN” horizon
- Top Birkhead - “E” horizon
- Top Hutton - “H” horizon
- Base Eromanga - “J” horizon
Grids for each surface are available in ASCII, Petrosys and Shapefile formats on SARIG.
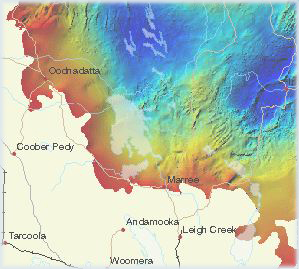
Area of project
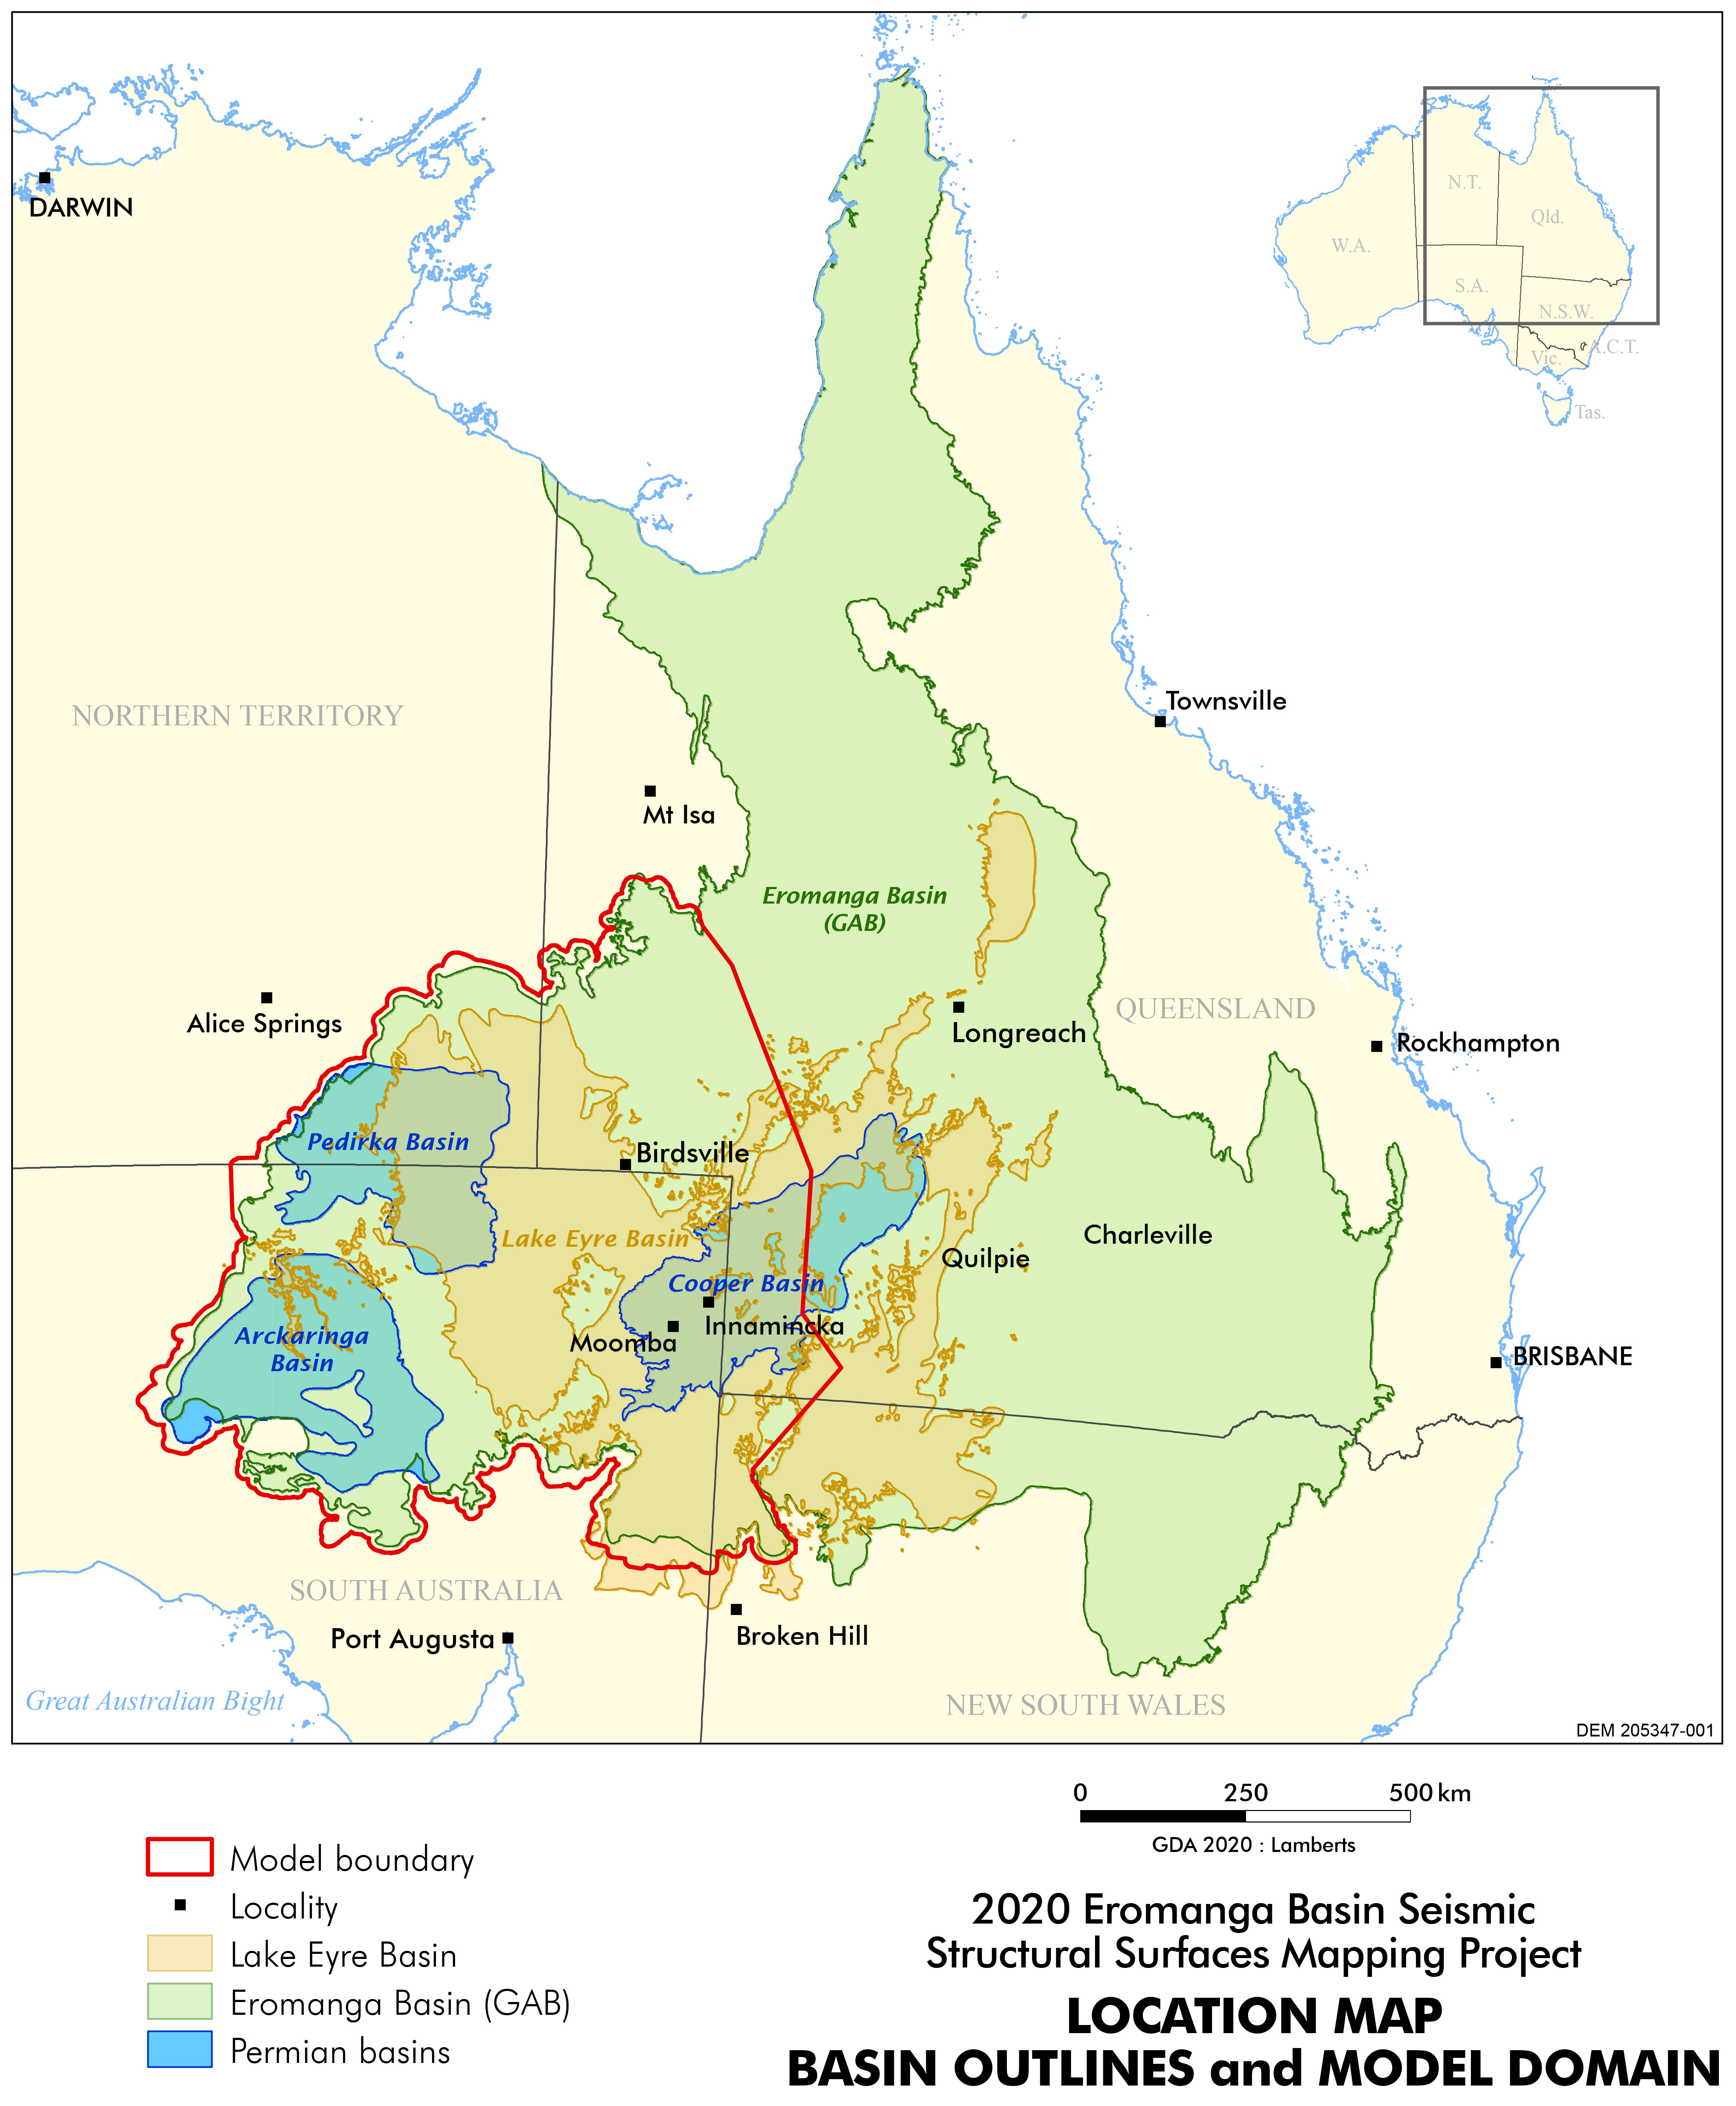
Location map of 2020 Eromanga Basin Seismic Structural Surfaces Mapping Project with basin outlines and model domain
Reference
Novak, M (2020): 2020 Eromanga Basin seismic structural surfaces mapping project: Extension and update for the Far North Prescribed Wells Area. Government of South Australia. Department for Energy and Mining Report Book 2020/00014
The aim of this study was to map the Great Artesian Basin in South Australia, including the depth to the top of the main aquifer, to the base, its thickness and overlying aquitard.
A package of data and interpretation from the 2012 Eromanga Basin Seismic Mapping project is available for download in ASCII, Petrosys and Shapefile formats from SARIG.
2009 update
Updates of the 2001 C, P and Z horizon maps, for both time and depth, are available for download in ASCII, Petrosys and Shapefile formats from SARIG. Created by the Department in 2008/09, these new horizon maps are:
- Based on the original 1997 and updated 2002 mapping
- Included current company interpretations made available to DEM
- Based on Cooper Basin exploration programs since 2000
The new depth grids have been tied to all available wells at the C, P and Z horizon levels.
2001 update
All data created during the 1997 regional mapping program were updated in 2001 to cater for the change in mapping datum from AGD 84 to GDA 94. Some refinements to the original data and maps were made but these were largely minor in nature.
A package of data and interpretation from the 2001 Cooper Basin Seismic Mapping project is available for download in ASCII, Petrosys and Shapefile formats from SARIG.
1997 mapping programme
Regional mapping was undertaken by the Department between 1995 and 1997 to provide explorers with a comprehensive view of the structure of the Cooper Basin. Three key seismic horizons were mapped using existing open file seismic sections and industry interpretations all tied to the extensive network of some 1300 wells in the basin. The horizons mapped were:
- Top Cadna-Owie (C horizon)
- Near-top Permian (P horizon)
- Top Warburton (Z horizon)
These horizons generally divide the basin into the gas prone units of the Permo-Triassic Cooper Basin and the overlying oil prone Jurassic Eromanga Basin. In addition to the C-P-Z horizons maps, another six horizons which divide the stratigraphic section further have been presented based on well data and phantomed on the key interpreted seismic horizons. Horizon maps have been converted to depth and an extensive range of isopach maps have been prepared.
A summary of the project including maps were included as part of the Cooper Basin Folio - Volume 1 (1998).
In conjunction with the Cooper Basin mapping, DEM completed similar mapping of the Eromanga and Pedirka Basins. This is a much more aerially extensive dataset than the Cooper Basin dataset and covers most of the extent of the Eromanga Basin (about 20% of South Australia). Maps were last updated in 2002.
An example, the Top Cadnaowie (C) seismic horizon map is available to view and download on SARIG.
Data and interpretation from the 2001 Eromanga Basin Seismic Mapping project are available for download in ASCII, Petrosys and Shapefile formats from SARIG.
 | 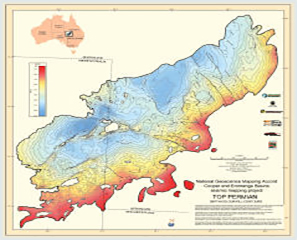 |  |
Regional seismic horizon maps
DEM in conjunction with AGSO (now Geoscience Australia) and the Queensland, New South Wales and Northern Territory government agencies merged data for three key seismic horizons to provide a complete regional (national) view of the structure of the Cooper and Eromanga Basins.
This project was completed in 1997/98 as part of the National Geoscience Mapping Accord (NGMA) and was a natural extension of the C-P-Z Mapping Project completed by the Department at the same time for the South Australian sector of the Cooper Basin area (see Cooper Basin C-P-Z Maps) and Eromanga Basin (see Eromanga Basin Seismic Maps).
Compilation was based on available seismic profile data, various company interpretations, other open file industry data, well tops and borehole data.
Final data products include Time maps (P and Z horizons), Depth maps (C, P, and Z horizons) and Isopachs (C-P, P-Z and C-Z) as well as grids and contour data for these horizons. All data was updated to the GDA 94 reference datum in 2000 and are available as free downloads from SARIG.
Officer Basin mapping products
In 1994 new seismic data was acquired in the Officer Basin as part of the South Australian Exploration Initiative. These data were interpreted in conjunction with existing open file company data to produce time and depth maps at Base Cambrian and Basement horizons. Time maps were also prepared over two local areas.
Some of the maps from this mapping are included in the publication Petroleum Geology of South Australia - Volume 3 - the Officer Basin.
This mapping has also been partially incorporated into Geoscience Australia's (formerly Australia Geological Survey Organisation (AGSO)) 1995 Officer Basin Atlas.
This large format atlas summarises the 1993/94 seismic results from the two seismic surveys recorded under the NGMA and SAEI exploration programs.
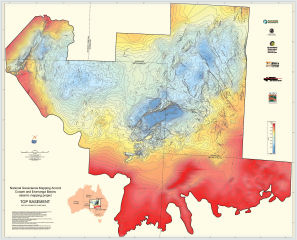
Featured map
Officer Basin leads and prospects (crystalline basement)
A package of data and interpretation from the 1994 Officer Basin Seismic Mapping project is available for download in ASCII, Petrosys and Shapefile formats from SARIG.
Otway Basin mapping products
Extensive mapping was undertaken between 1992 and 1994 to provide explorers with a comprehensive view of the structure of the Otway Basin. Four key seismic horizons have been mapped using existing open file seismic sections and industry interpretations, and tied to the network of 50 wells in the basin.
These horizons – Top Sherbrook Group (late Cretaceous), Top Eumeralla Formation (early Cretaceous), Top Crayfish Group (early Cretaceous) and Top Basement (early Palaeozoic) generally divide the basin into megasequence units. Horizon maps have been converted to depth and a range of isopach maps have been prepared.
Many of the maps from this mapping are included in the publication Petroleum Geology of South Australia - Volume 1 - the Otway Basin (PDF 25MB)
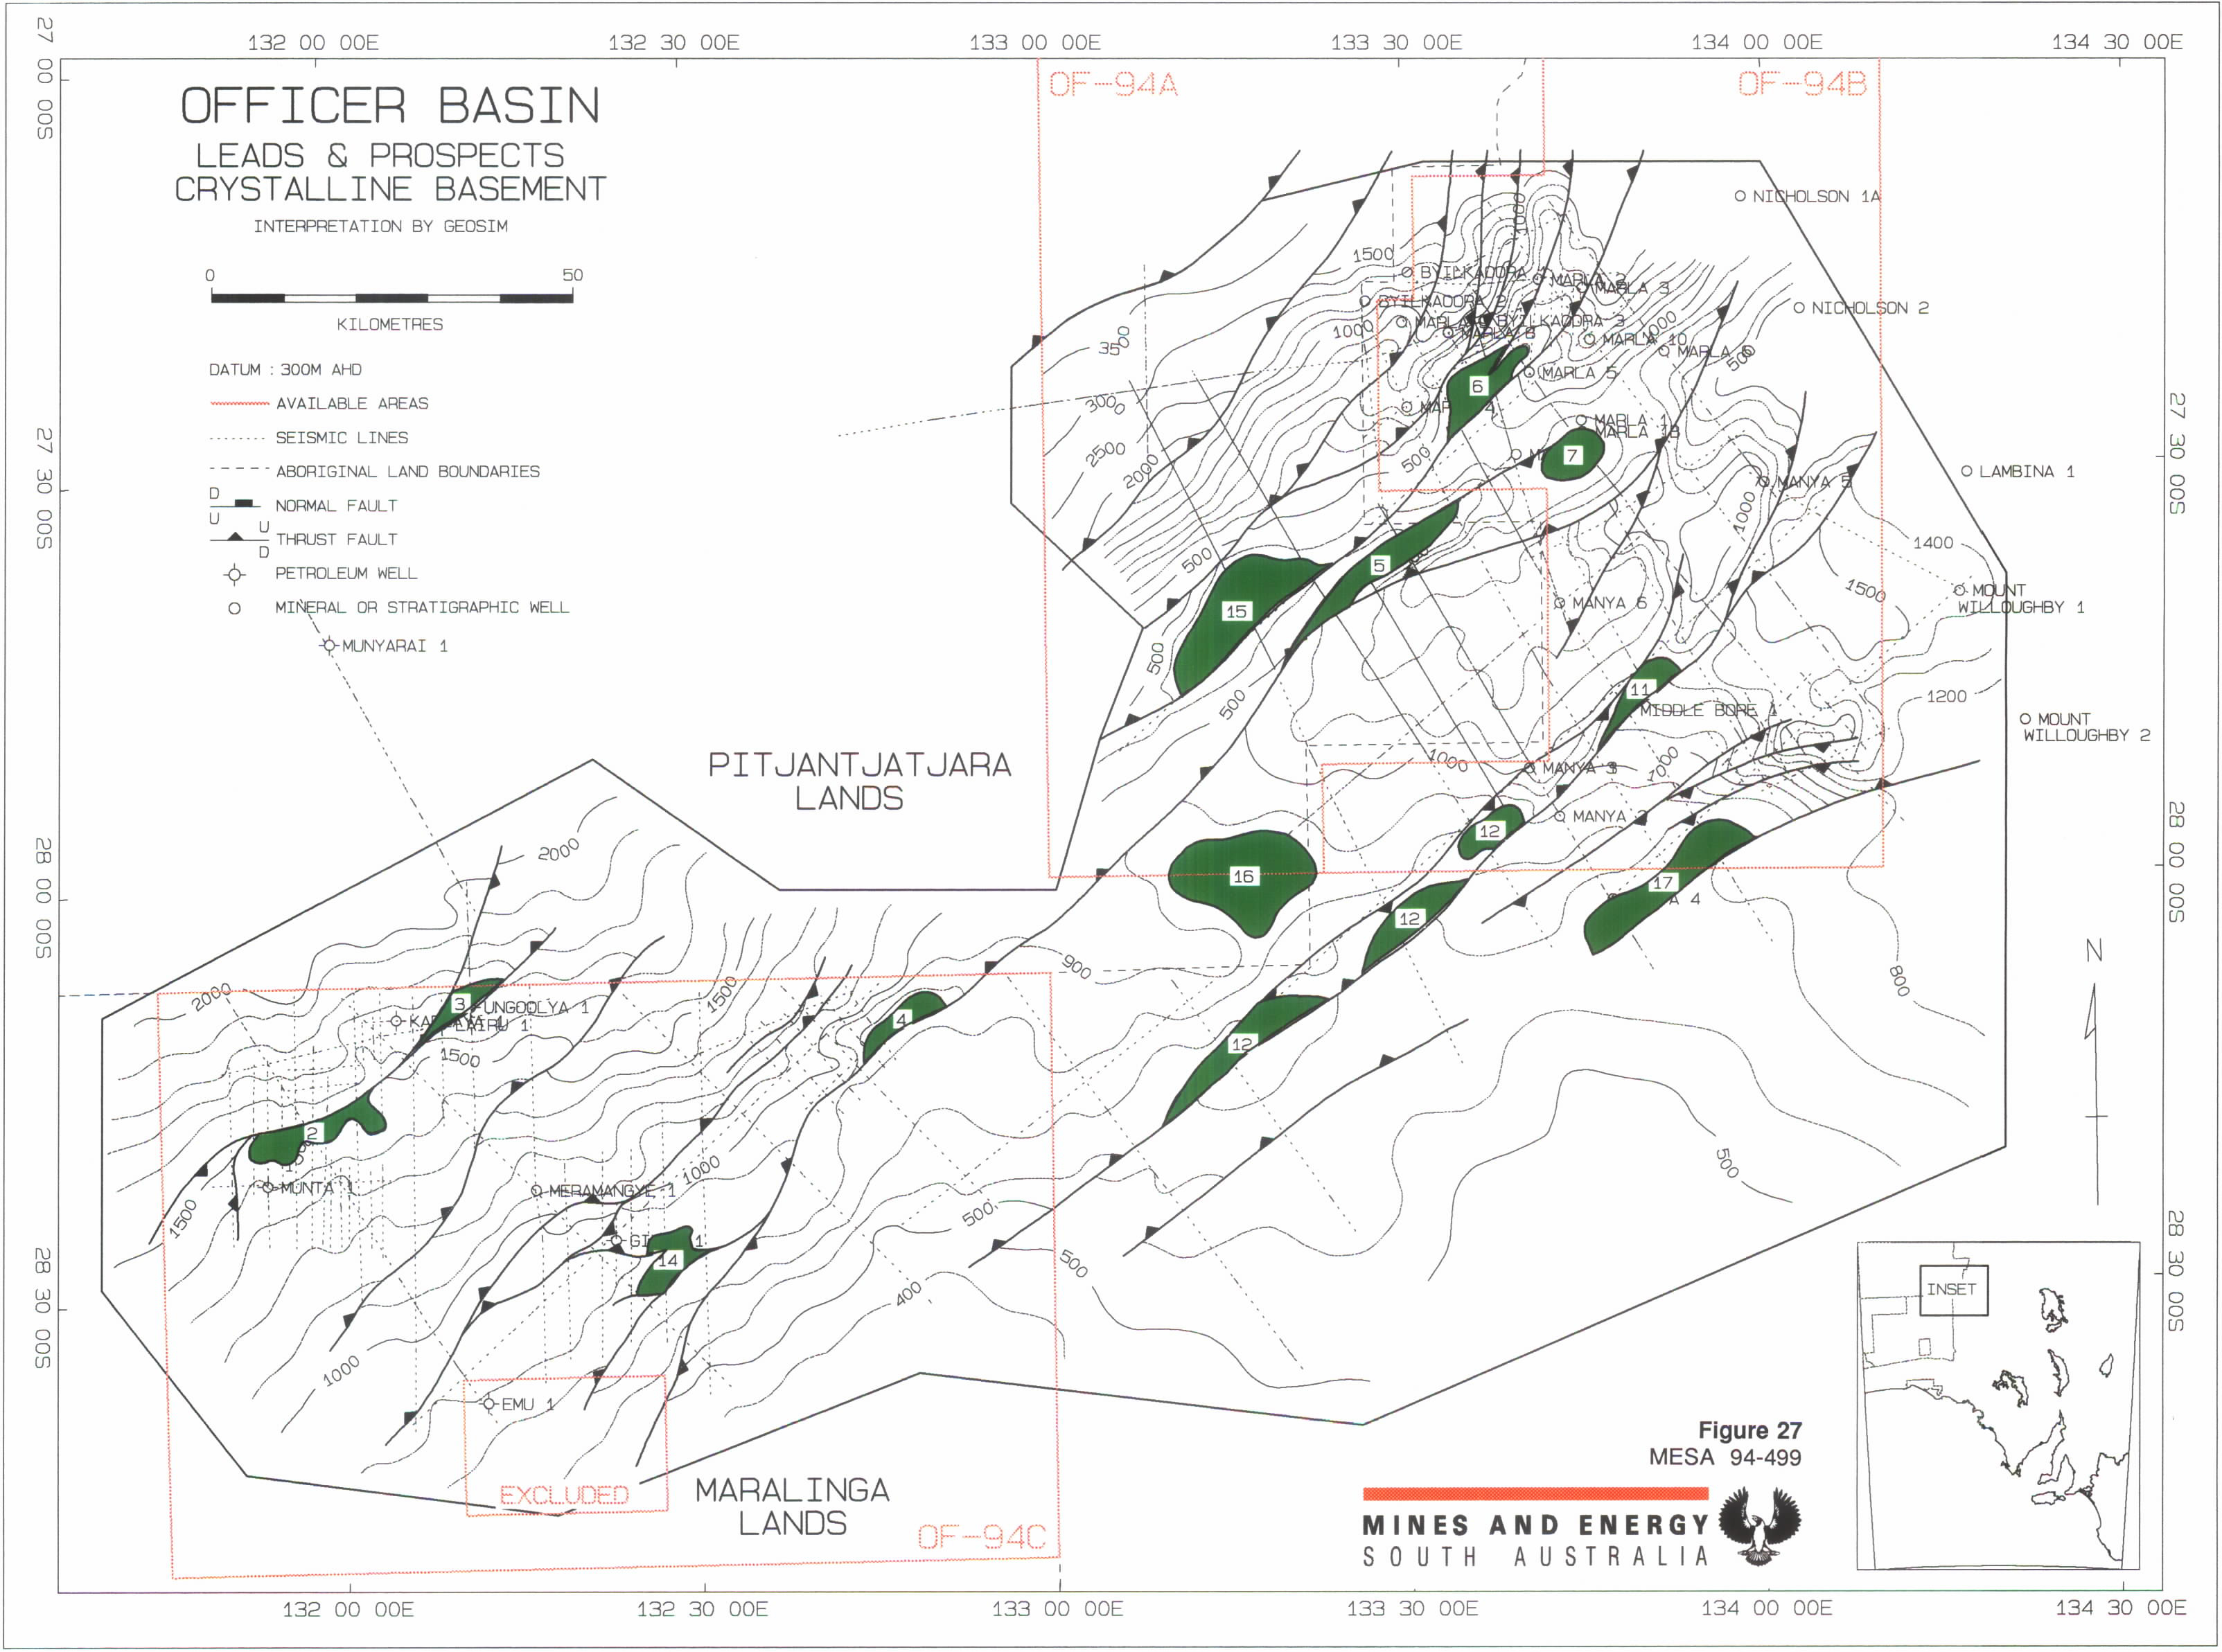
Featured map
Top Eumeralla Formation depth map
Mapping was updated in 2001 following the acquisition of additional seismic data in the basin.
A package of data and interpretation from the 2001 Otway Basin Seismic Mapping project is available for download in ASCII, Petrosys and Shapefile formats from SARIG.
Pedirka Basin-Poolowanna Trough mapping products
Play analysis in the Pedirka Basin-Poolowanna Trough region was conducted by DEM in 2021/2 with the intention of stimulating exploration for hydrocarbons in this region. Four intervals were reviewed:
- the Jurassic-Cretaceous Algebuckina Formation of the Eromanga Basin;
- the Jurassic Poolowanna Formation of the Eromanga Basin;
- the Peera Peera Formation of the Triassic Simpson Basin; and
- the Permian Purni Formation of the Pedirka Basin
The results have been documented on the Geology and Prospectivity section.
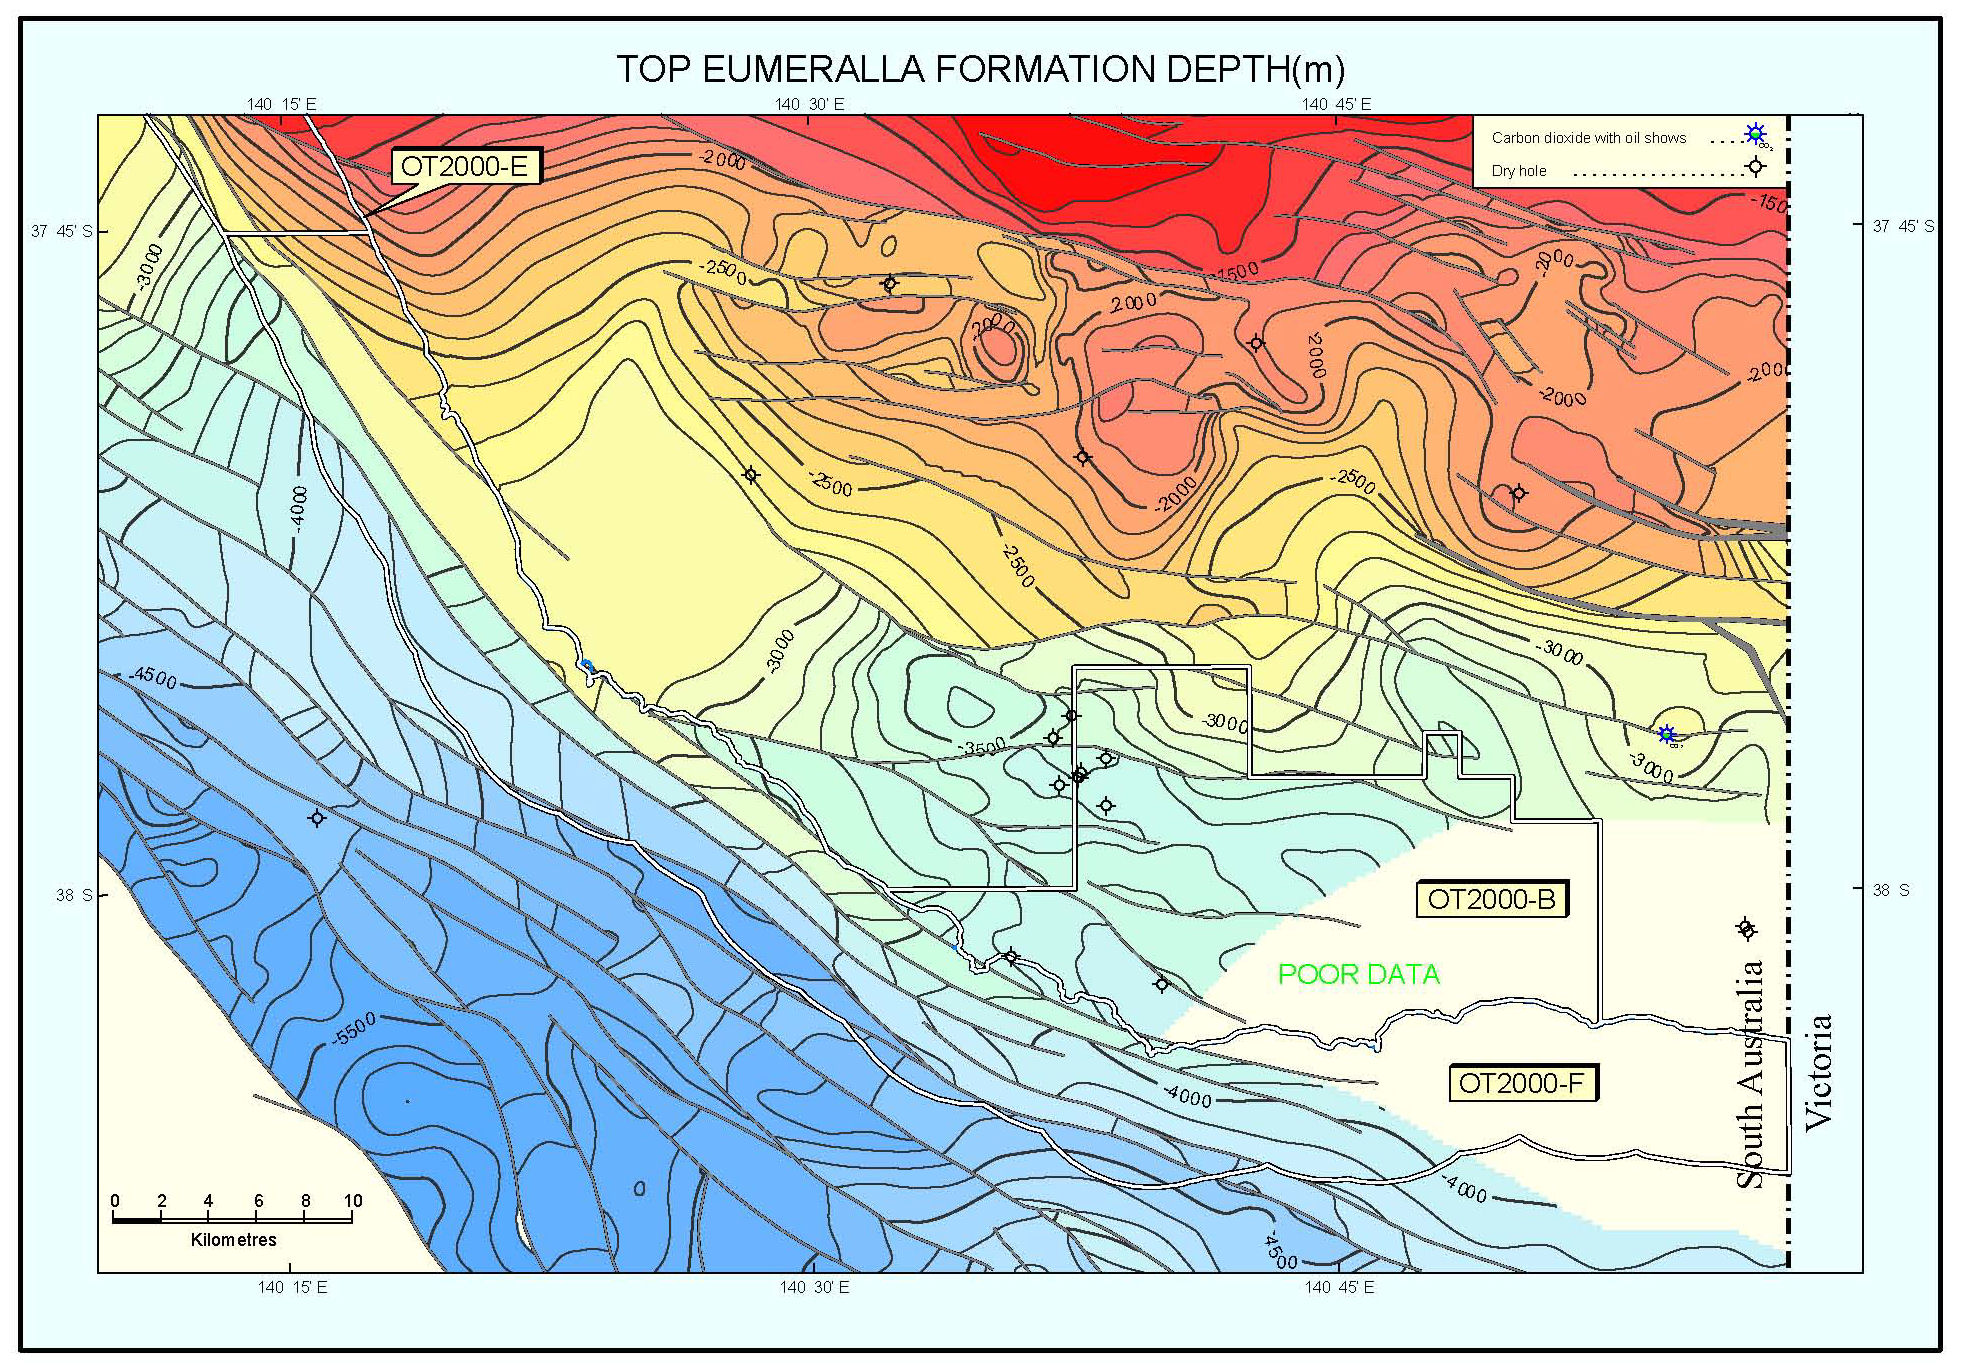
Featured map
Approximate extent of the Poolowanna Formation play in the Poolowanna Trough region.
Mapping was conducted in 2015 as part of the Pedirka Basin Aquifer Study. Data and interpretation are available in ASCII, Petrosys and Shapefile formats on SARIG.
Featured map
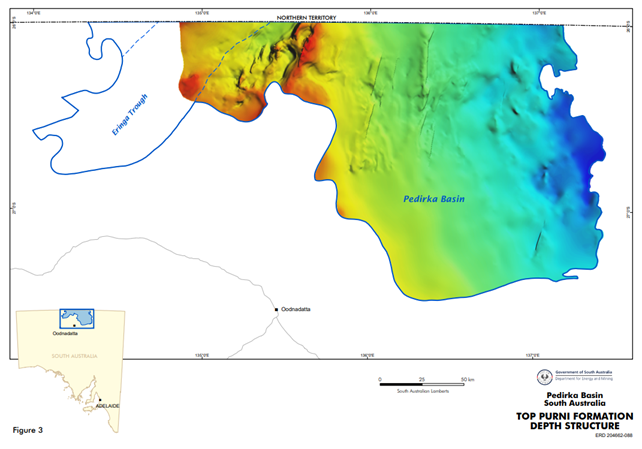
Top Purni Formation depth structure map in the Pedirka Basin, South Australia
Mapping was conducted as part of the Eromanga Basin 2001 Seismic Mapping Project. Data and interpretation for the Pedirka Basin are available for download in ASCII, Petrosys and Shapefile formats from SARIG.