The Government of South Australia collates and publishes geophysical data from exploration company and government surveys for the state.
View recent exploration data releases
Data from the following geophysical methods are prepared by the Geological Survey of South Australia and are available for download via SARIG.
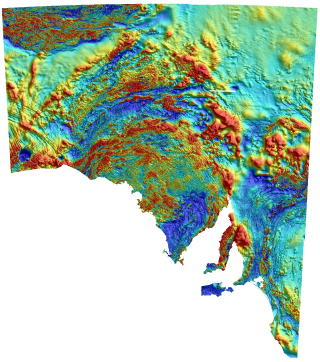 The magnetic field around the Earth varies spatially, and this information is recorded in aeromagnetic surveys.
Magnetic surveys highlight differences in the degree of magnetic susceptibility present in rocks near the surface. The red to orange areas indicate rocks and soils that contain significant amounts of magnetic minerals. The blue areas signify relatively non-magnetic rock sequences. Red areas are potentially more prospective for metallic minerals and require detailed ground surveys and eventual drilling to establish the magnetic source.
These surveys aid geological mapping and interpretation of concealed bedrock structures, and suggest where exploration for mineral deposits may be focused.
Magnetic data are freely available as raw data (ASCII columns) and gridded images. The raw company data, grids, shapefiles and reports from individual surveys are available via the Spatial Search tab in SARIG, and the statewide grids are also downloadable through the SARIG Regional Geophysical Images map layer group. Statewide grids are routinely updated as new surveys become available. Typically, data is available in a variety of formats: Total Magnetic Intensity (TMI), Reduced to the Pole (RTP), as well as First Vertical Derivative (1VD) images. Currently there are over 300 magnetic surveys available on SARIG.
 Gravity surveys measure the acceleration due to gravity. Typically this is around 9.8 ms-2 at the surface of the Earth, however a gravity survey will measure variations in this value to (approximately) eight decimal places. Variations in acceleration give us information relating to the density of subsurface material. There will be a larger pull of gravity over rocks with high density (e.g. gold bearing rocks) than over areas with low density (e.g. porous sandstone).
Gravity surveys are undertaken by company, government, and university geophysicists, and the Government of South Australia collates all this information into a single database. The located data are available through the Geophysical surveys layer in SARIG ('Gravity – stations'), and the statewide grids are also downloadable through the SARIG Regional Geophysical Images map layer group.
There are over 800,000 stations in the database, the most comprehensive in Australia.
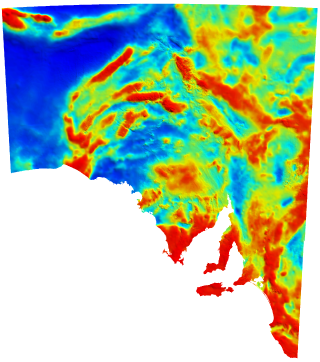
 Radiometric surveys are conducted either on the ground or from an airborne platform, and measure gamma rays emitted from the near-surface of the Earth. Radiometric Surveys are particularly useful for regolith studies, showing the distribution of Potassium, Thorium and Uranium elements in the soil. Radiometric surveys are commonly undertaken at the same time as aeromagnetic surveys.
Radiometric data are freely available as raw data (ASCII columns) and gridded images. The raw company data, grids, shapefiles and reports from individual surveys are available via the Spatial Search tab in SARIG, and the statewide grids are also downloadable through the SARIG Regional Geophysical Images map layer group. Statewide grids are routinely updated as new surveys become available. The flavours of radiometric statewide grids include Potassium, Thorium, Uranium, Total Count, Dose rate, as well as a Ternary (RGB) image and U/Th image.
Currently there are over 300 radiometric surveys available on SARIG.
Airborne electromagnetics (AEM) involves transmitting an electromagnetic field, shutting it off, and recording any electromagnetic fields produced as the result of eddy currents in the ground. This gives the geophysicist an idea of the conductivity of the subsurface. The technique has been successfully used to locate underground paleochannels.
Ground electromagnetics is similar, but data is acquired from the surface of the Earth and due to collection being on foot, cover a much smaller area.
AEM is collected either using a helicopter or aeroplane, and there are a variety of different systems available to the explorer including Tempest, VTEM, RepTEM, Input and Megatem.
Currently there are over 70 AEM surveys available through the Spatial Search tab in SARIG, and a large number of small scale ground EM survey data are attached to open file envelopes.
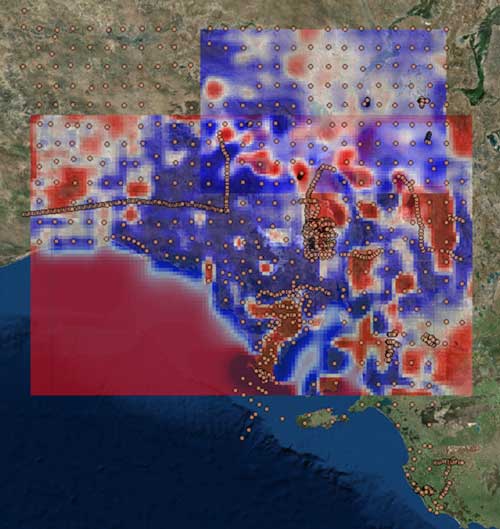
Magnetotellurics (MT) is an electromagnetic method of imaging the earth's subsurface. It uses natural variations in the earth's magnetic field to map contrasts in the electrical resistivity of the subsurface. These data are used to image changes in the electrical resistivity over a large range of depths: from the top of the crust to the mantle. Such resistivity models are then interpreted geologically in terms of the fluid, thermal and structural evolution of the lithosphere.
Over the last thirty years many sets of magnetotelluric (MT) data have been collected across South Australia, and much of this is available for download from SARIG as a series of .edi files via the Electrical Survey (Magnetotellurics (MT)) map layer.
Direct measurements of the physical properties of rocks give us petrophysical information. Petrophysical information is collected either from hand specimens, or from downhole logging. The Geological Survey of South Australia collates this information from company reports and from our world class drill core facilities and makes them available online through SARIG.
The three types of petrophysical data downloadable through the SARIG Drillhole module are density, magnetic susceptibility, and gamma radiation.
There are a variety of different electrical methods that used to image different electrical properties of the subsurface. The Resistivity technique is used to determine the resistivity of subsurface materials, the Induced Polarization (IP) technique is used to measure the decay of voltage in the ground, and the Self Potential (SP) technique looks for natural voltage sources underground.
These datasets are usually attached to open file envelopes as text files, or images of the data presented in the reports, and are available for download via SARIG.
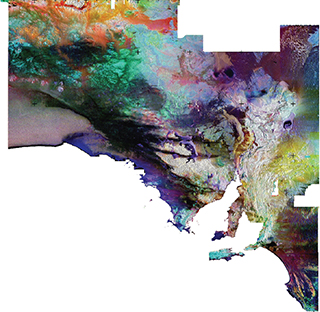
The Geological Survey of South Australia also prepares some geophysical derived products, available for download from SARIG.
Statewide imagery
Images from individual magnetic, radiometric and gravity surveys can be combined to produce seamless, continuous images of the state. These statewide images are available to download from the SARIG Regional Geophysical Images map layer group as .ers and .tiff images. They can also be clipped to size using the Geophysical Databases tool in SARIG.
Gradient strings
Gradient strings, also known as multi-scale edges or worms, reflect changes in rock properties, often mirroring geological or lithological boundaries. They are created by calculating the maximum horizontal derivative for different levels of upward continued geophysical data.
The gradient string datasets are available from the SARIG Gravity - Gradient Strings map layer as a series of shapefiles.
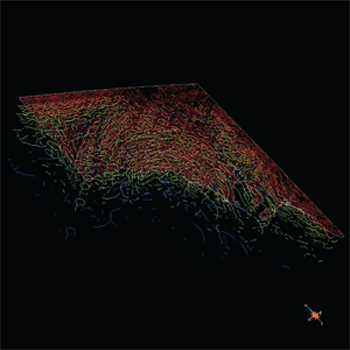
Magnetic gradient strings
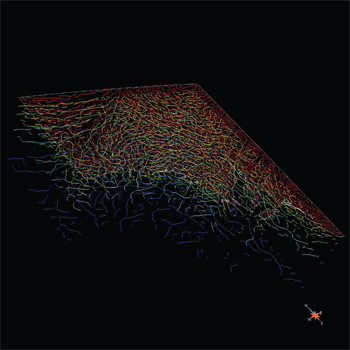
Gravity gradient strings
Electrical resistivity models
Electrical resistivity depth slices, and if available, 3D models, have been derived from the AusLAMP magnetotelluric data. The depth slices and/or 3D resistivity models are available for download from SARIG and cover most of South Australia.