
Remote sensing uses reflected solar radiation and emitted/reflected thermal radiation from the earth’s surface to map changes in surface materials through variation in their spectral absorbance. Some minerals, for instance, show characteristic absorbance features that alter with changes in crystal structure, molecular substitution, and water content. The spatial pattern of spectral variations can assist in understanding geological processes and may provide mineralogical vectors to sites of economic mineralisation. Continuous, close-spaced spectral wavelength measurements, termed hyperspectral data, are more amenable to mineral analysis than data from multi-spectral instruments that have fewer selected broad spectral channels.
Remote sensing imagery is used extensively at GSSA as an aid in geological and regolith interpretation and map compilation. The wide coverage, high spatial resolution and multispectral capabilities make these data most useful in remote and arid environments where geological information is limited. In these regions, effective fieldwork requires targeting key areas of geological significance. These can be identified from remotely sensed data by using spectral enhancement and image processing, such as mineral maps, false colour images, band ratios and principal components to extract information on lithologies, geological settings, landforms, structural features, spectral variations indicative of geochemical signatures associated with alteration, weathering and vegetation patterns, and the discovery of subtle or subdued areas of outcrop.
Remote Sensing technologies used by the GSSA are outlined below. Data products from various platforms or data from specific surveys are available upon request for the areas indicated on the SARIG Remote Sensing Catalogue map layers.
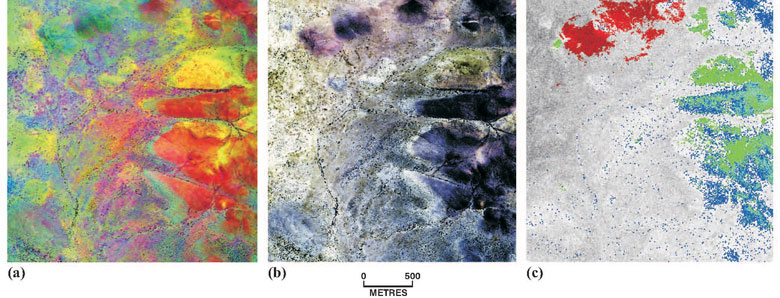
HyMap airborne spectral images of Gawler Range Volcanics, 8 km east of Gibraltar. (a) RGB image with decorellation stretch highlighting Ealbara Rhyolite outcrop in yellow and red tones, (b) atmospherically corrected RGB (2.4820:2.240:2.1710) showing areas of outcrop (dark), (c) mineral abundance from spectral analysis in which chlorite (red) maps the distribution of chloritic mudstones of Mentor Formation and varying mica compositions (blue and green) within Ealbara Rhyolite, map probable effects of hydrothermal alteration.
HyMap is an airborne hyperspectral sensing technology used in mineral mapping, mostly for project or specific regional applications. The instrument has comparatively high spatial resolution of 3 to 5 m pixel size and is popular due to its superior signal-to noise characteristics, its accuracy of calibration, the incorporation of bands for atmospheric modelling, and positioning of band passes specifically selected to assist mineral identification.
GSSA has a collection of HyMap data flown for specific project areas and has arranged for historical HyMap data to be reprocessed using new techniques developed by HyVista Corporation, to provide colour balanced, geometrically accurate, mosaiced products with standard geological image maps that can be used in GIS. The reprocessed datasets are now available upon request for the areas indicated on the on SARIG HyMap Remote Sensing Map Layer.
Combinations of Landsat Thematic Mapper (TM) bands provide information about landscape and regolith materials for use in geological mapping. The combination of Bands 1 and 7, at 485 and 2200 micron wavelength regions of reflected solar radiation, provide geological information which can be interpreted using false-colour images that reflect the combination of spectral absorptions from minerals such as iron oxides, phyllosilicates and carbonates.
The GSSA has a complete State coverage and maps with Landsat 5 TM and Landsat 7 ETM+.
Advanced Spaceborne Thermal Emission and Reflection Radiometer (ASTER) is a sensor onboard the Terra satellite, launched by NASA in December 1999. ASTER data has 14 spectral bands designed specifically to measure diagnostic absorption bands related to mineral groups like clays, carbonates, silica and iron oxides.
From these bands the CSIRO’s Centre for 3D Mineral Mapping (C3DMM) developed a processing methodology to transform the raw data into 17 geoscience products that reflect relative mineral abundance derived from the Visible-Near Infrared (VNIR), Shortwave infrared (SWIR) and Thermal Infrared (TIR) bands. These are available as regional mineral maps via the CSIRO Data Access Portal - Satellite ASTER Geoscience Map of Australia.
The earth’s surface radiant temperature is recorded with Advanced Very High Resolution Radiometer (AVHRR) sensors on board NOAA (National Oceanic and Atmospheric Administration) satellites. The detector and orbital configuration of NOAA–AVHRR night-time data make it a very useful remote-sensing method for detecting variations in surface geology particularly related to paleodrainage systems. Paleodrainge systems are often buried but show up clearly as dendritic patterns in the night-time data. The physics is not clear but one explanation is that the signal identifies soil moisture variation. Another explanation has to do with the roughness of the surface. Either way paleochannels are highlighted in night-time thermal data due to the temperature difference between the channel fills and the surrounding basement terrain.
Related links
- Alteration mapping of the Tarcoola Goldfield (South Australia) using a suite of hyperspectral methods. Applied Earth Science 116(1):2-12.
- ASTER night-time thermal infrared data: interpreting subsurface features from high resolution data. MESA Journal 43:36-39.
- Role for airborne hyperspectral surveys in the search for diamonds in the Flinders Ranges. MESA Journal 39:30-33.
- How well does remote sensing aid palaeochannel identification? An example from the Harris Greenstone Belt. MESA Journal 38:46-52.
- Geological mapping for mineral exploration using ASTER data. MESA Journal 30:16-19.
- Mineral mapping in the Gawler Craton. MESA Journal 18:22-23.
- Palaeodrainage and Cenozoic coastal barriers of South Australia (2nd edition). DIGIMAP 00002.